Scientific photography and astronomy
Technology applied to understanding the universe

Figure 1. Photograph of the Milky Way taken with an exposure time of less than 30 seconds and a wide-angle lens from the AstroCamp Astronomical Complex in Nerpio (Albacete, Spain)./ F. Ábalos Vázquez
In 1925, Edwin Hubble took the first step towards increasing the size of the known universe by several orders of magnitude using the precarious photographic methods available at the time: glass plates and photosensitive emulsions. Analysing periodic variations in the brightness of certain stars (Cepheids) through photographs, Hubble was able to show that the distance between Andromeda and the Earth was much greater than previously thought. Thus, Andromeda, previously thought to be a nebula, had to be a galaxy different from our own. Suddenly, the estimated size of the universe went from a few hundred thousand light years to a few billion light years. Since then, the synergy between photographic technology and astronomy has continued to grow.
Keywords: astronomy, digital photography, light, technology, universe.
The vastness of the universe is beyond our imagination. We now know that it contains billions of galaxies like our own and that we live on the third planet of a solar system located in one of the peripheral arms of a spiral galaxy, the Milky Way, in a cluster that contains at least 40 other galaxies.
However, 100 years ago, many astronomers argued that all objects observable in the night sky from Earth must belong to the Milky Way (Figure 1), i.e., to our galaxy (Shapley & Curtis, 1921). Nebulae (such as the Running Man Nebula, Figure 2a) are, roughly speaking, clouds of gas and dust. They can be divided into two main groups: some correspond to regions in which stars are forming, and others are formed from the gases and materials ejected by dying or exploding stars (supernovae). To be observed from Earth, they must be illuminated by nearby stars (Figure 2b), although they can also be seen when they consist of luminescent gases if they contain elements in an ionised state. There are also dark nebulae that have only been detected as shadows outlined by more distant stars or other bright nebulae (Figure 2c). Although we now distinguish a wide variety of extragalactic objects such as nebulae, star clusters, comets, and finally, other galaxies, 100 years ago, any object with a nebulous appearance was considered to be another nebula in the Milky Way. After all, the appearance of different celestial objects was remarkably similar; everything seemed to be in our galaxy, because that was the whole known universe.
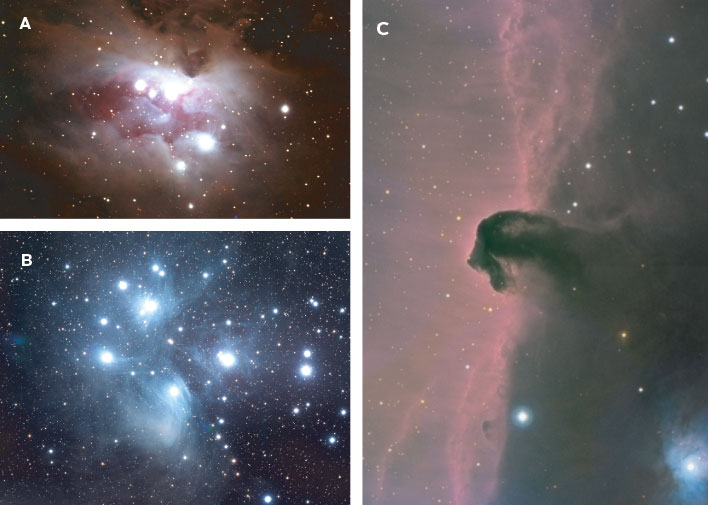
Figure 2. A) Running Man Nebula, a reflection nebula in the Orion constellation. B) The Pleiades, an open star cluster in the Taurus constellation. The faint reflection nebulosity seen around the stars is not related to the formation of the cluster but rather, a dust cloud in the interstellar medium through which the stars in the cluster are passing. C) Horsehead Nebula, a cloud of cold, dark gas in the Orion molecular cloud complex. Around this absorption nebula are other emission nebulae such as the flame nebula. / Photos: F. Ábalos Vázquez
Distance to the stars
This view of the universe changed at the beginning of the 20th century thanks for the use of scientific photography in astronomy. In particular, its application to the precise measurement of the brightness of stars: photometry. One of the key figures in this paradigm shift was Edward Pickering, director of the Harvard Astronomical Observatory. At the end of the 19th century, he began a monumental project to take hundreds of photographs (glass plates with photosensitive emulsions) of both hemispheres of the sky. He was assisted by a team of women (Figure 3a) who patiently analysed each plate, counting the stars, recording their brightness and calculating their celestial coordinates (Cassinello Espinosa, 2019).
At the time, very few women were working in anything related to science. The example of these pioneers was fundamental in overcoming prejudice against women and facilitating their inclusion in scientific research (Rossiter, 1980). One of them, Henrietta Leavitt (Figure 3b), made a discovery that was fundamental to Edwin Hubble’s later study of the dimensions of the universe. By analysing the position and magnitude (brightness) of a large number of stars, Leavitt discovered that some of them fluctuated in brightness with a period of between one and 120 days – i.e., they are variable stars. Leavitt studied thousands of variable stars in both hemispheres of the sky and described different types, highlighting those she called Cepheids, because the first one identified as such was in the constellation Cepheus. The essential feature that made Cepheids interesting was that their period of variation was proportional to their true or absolute magnitude, which provided a method of measuring their distance from Earth (Leavitt & Pickering, 1912). The period of variation gives their absolute magnitude, and the photograph gives the apparent magnitude as seen from the Earth, from which the distance to the star can be deduced (the measured magnitude is inversely proportional to the square of the distance).
Until then, the only techniques available to measure the distance to other stars (triangulation and parallax) could only be applied to very close stars. Leavitt validated this new method, based on the relationship between the magnitude and period of the Cepheids, by applying it to stars to which the parallax method could also be applied, obtaining remarkably similar results. Thus, for the first time in history, astronomers had a method to reliably measure the enormous distances to the farthest objects in the universe.
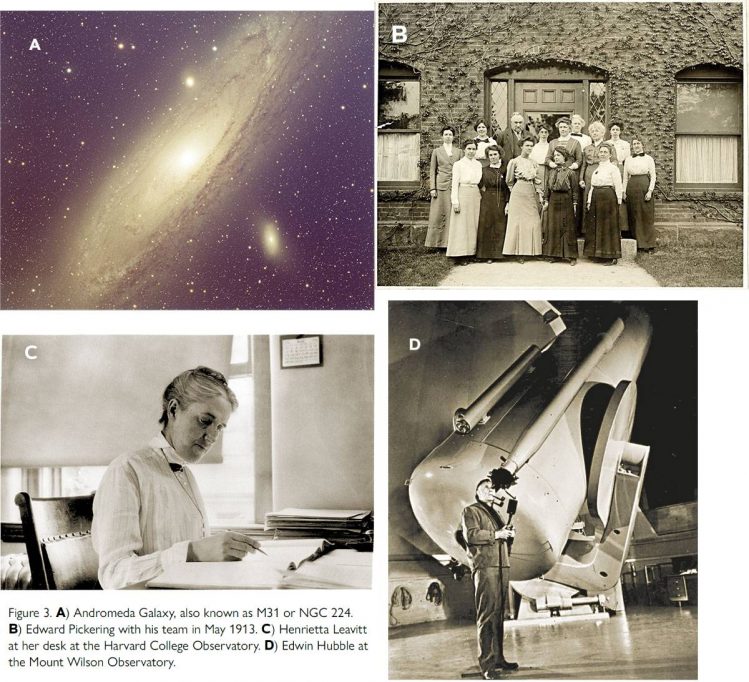
Photos: F. Ábalos-Vázquez (A), Harvard–Smithsonian Center for Astrophysics. (B), Harvard–Smithsonian Center for Astrophysics (C), Mt. Wilson Archive, Carnegie Institution of Washington. Credit: Harvard–Smithsonian Center for Astrophysics (D)
Henrietta Leavitt went to the extent of measuring the variable stars in the Small Magellanic Cloud (a galaxy close to Earth), not realising that it was actually an outer galaxy. A few years later, Edwin Hubble found Cepheid variable stars in what was then called the Andromeda «nebula» and used Leavitt’s method to estimate the distance of this object from Earth (Figures 3c and 3d). The measurements contained large errors compared with what can be achieved today, but the key insight was that this distance was at least 20 times greater than the best estimates of the size of our galaxy, thus placing Andromeda out of the known universe at the time. This meant that it was another galaxy made up of hundreds of thousands of stars like our own, rather than a collection of dust situated within our galaxy. The nebulae in our galaxy are thousands or tens of thousands of light years away, but the outer galaxies are millions or even billions of light years away. It was not long before the discovery that many so-called nebulae were actually «other universes», outer galaxies comprising billions of stars (Figure 4); the known universe had suddenly become immensely larger.
The search for other worlds
About 100 years later, technology had improved to such an extent that even an advanced amateur astronomer has now far more sophisticated tools at their disposal than Pickering, Leavitt, or Hubble had had (see «A brief technical introduction to astrophotography»). It should be noted, however, that the advances in astronomy were not due to photography alone but rather, to the rapid improvement in astronomical instrumentation as a whole (telescopes, digital sensors, spectrographs, etc.). Among the many possibilities opened up by this true technological revolution, the search for exoplanets (planets orbiting other stars) stands out for its popularity and for having produced some of the most fascinating discoveries of recent years (Mayor & Queloz, 1995), work which was rewarded with the Nobel Prize in 2019. We can detect exoplanets indirectly by quantifying the periodic variation in the magnitude of certain stars because of the passage of one of their planets between the star and us – a variation often so faint that it was impossible to detect before the advent of modern digital sensors. By recording the brightness of a star over time, we can construct a magnitude curve from which we can infer the mass and distance of the host star, as well as the size, mass, and orbital period of the potential exoplanet. Another technique for detecting exoplanets which is also based on photography is to photograph nearby stars whose own motion can be observed relative to the more distant «stellar background». In some cases, their motion turns out to be wavy rather than straight. This is because they may belong to a large planet that is slightly deflecting their orbit. This is similar to the exoplanets described above, except that the exoplanet in question does not obscure the star when observed from Earth.
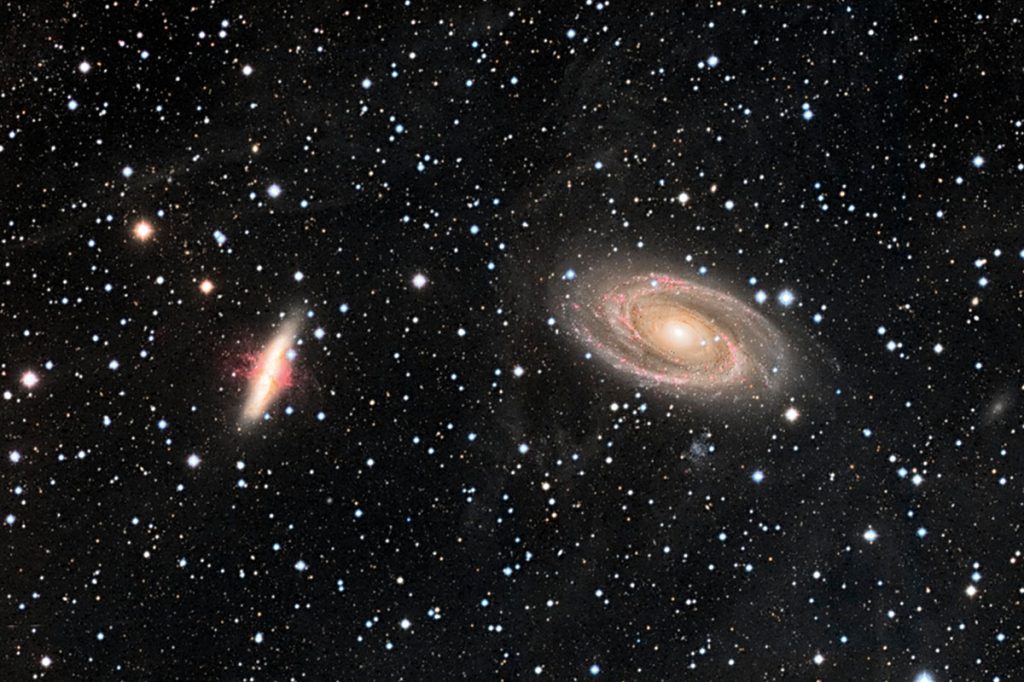
Figure 4. Two galaxies: M81 (on the right) and M82 (on the left). Although from Earth they appear to be separated by just the diameter of the Moon, the distance between them is actually about 150,000 light-years. / F. Ábalos Vázquez
Both of these exoplanet search techniques are now within the reach of amateur astronomers. There are many reasons fuelling the interest of finding exoplanets. Every new candidate tells us something about how the universe works. By discovering exoplanets, we can witness parallels to the birth of other solar systems and learn about our own origins. They also give us a better idea of the rich diversity of planets in the universe. The more than 4,000 exoplanets described so far include some that bear a striking resemblance to the icy or desert worlds of science fiction, but there are also others that exceed our wildest dreams (e.g., Kepler-51 b, c, and d, described by their discoverers as giant «cotton-candy balls» the size of Jupiter but several hundred times smaller in mass) (Libby-Roberts et al., 2020). Finally, perhaps one of the most common motivations in the search for exoplanets is the possibility of finding other planets compatible with life as we know it on Earth. Astronomers term habitable zone (or Goldilocks zone) the region around a star in which an exoplanet could host liquid water (given the right mass and atmospheric pressure). Therefore, one of the most important parameters for determining whether an exoplanet is habitable is its distance to the star around which it orbits. The mass, absolute magnitude and periodicity of the host star can be used to determine whether an exoplanet is in the habitable zone. About 20 exoplanets in the habitable zone of the Milky Way have been described to date, although it is estimated that there could actually be as many as 40 billion (Bryson et al., 2021; Petigura et al., 2013).
What is the universe made of?
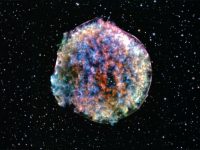
Advances in imaging detectors have been key not only to the search for exoplanets, but also to the study of the chemical composition of the universe. It is worth remembering that the entire universe is made up of the same matter, almost all of it in the form of hydrogen atoms, the first element in the periodic table. The rich variety of chemical elements found on Earth (but also in other planets, nebulae, and comets, etc.) were formed from hydrogen by nuclear reactions in the extreme conditions inside stars. Our bodies – but also, for example, the comet C/2020 F3 (NEOWISE) shown in Figure 5 – constitute the temporary aggregation of a collection of atoms (carbon, hydrogen, iron, silicon, etc.) that were formed in many different stars billions of years ago and will eventually disperse throughout the universe again.
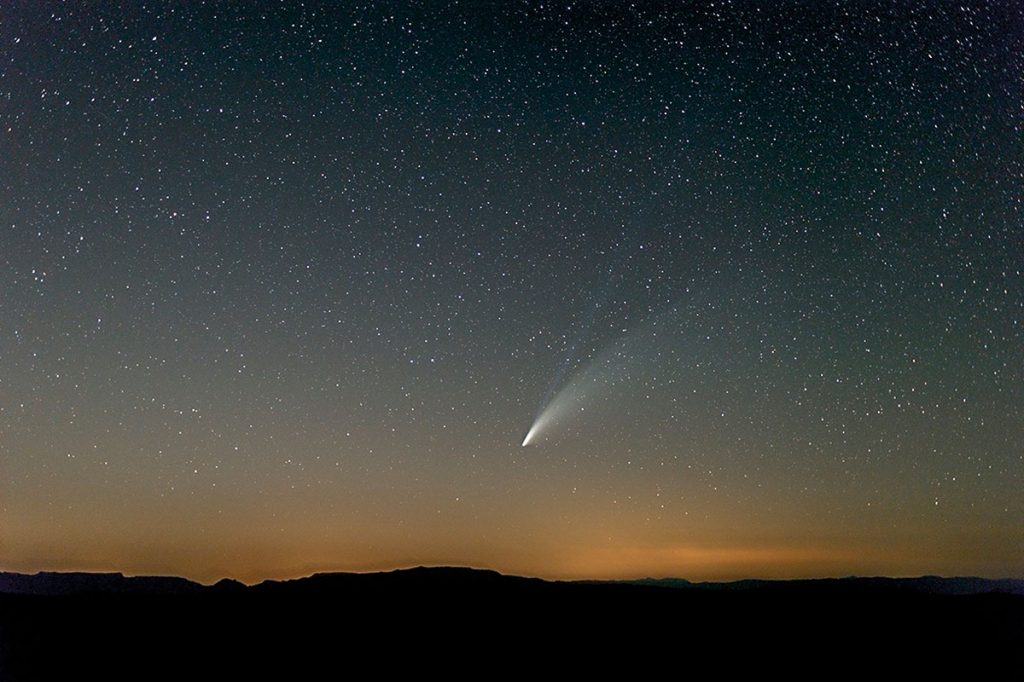
Figure 5. Comet C/2020 F3 (NEOWISE), discovered in March 2020. It was observable even to the naked eye for the entire month of July 2020, something that will not happen again for several thousands of years. / F. Ábalos Vázquez
Spectroscopy is used to study the chemical composition of objects in the universe. It can be used to break down the light coming from a star, for example, and determine the elements it contains based on its electromagnetic spectrum. When heated, each element in the periodic table emits light in a wavelength pattern that varies very specifically with temperature. The emission spectra of the various elements have been studied in the laboratory since the second half of the 19th century (Huggins & Miller, 1864). The process consists of splitting the light emitted by a substance heated to incandescence by passing it through an optical prism. The result is a discontinuous spectrum, mainly black with some coloured bands. Each element only emits light at a few extremely specific wavelengths. However, if we keep the element in question cold, illuminate it with white light, and split the transmitted light with an optical prism, we obtain a spectrum of colours interrupted by a series of dark bands that coincide with the coloured bands in the emission spectrum (each element absorbs light at the same wavelengths as it emits light in incandescence). Once a catalogue of the «spectral signatures» of the different elements has been compiled, this knowledge can be used to determine the composition and temperature of stars and other celestial objects. Nevertheless, because of their low brightness, obtaining reliable spectra for most celestial objects was difficult or impossible before the advent of modern digital photographic sensors.
The work of pioneers such as Joseph von Fraunhofer (who, in 1823, wrote that other stars had emission bands similar to those of the Sun), Sir William Huggins (who, in 1864, identified these bands and paired them to elements found on Earth), or the Italian Jesuit Pietro Angelo Secchi (who, in 1868, collected more than 4,000 spectra from different stars by splitting light captured in a telescope with an optical prism), showed that there are many Sun-like stars in the universe and that the Sun and stars are made up of the same elements found on Earth (Cassinello Espinosa, 2019; Taton & Curtis, 1995). Thus, the idea that our solar system was some kind of exception in the universe had to be abandoned. Today, spectroscopic and photographic techniques are so advanced that astronomers can, for example, obtain spectra of a star’s light filtered through the atmosphere of one of its exoplanets, allowing them to study the presence of water and other parameters necessary for life (Benneke et al., 2019).
An expanding universe
Another key contribution to astronomy that we owe to imaging spectroscopy is the empirical confirmation that the universe is expanding. Since the second half of the 19th century, astronomers such as Sir William Huggins or Vesto Slipher had described that the spectra of many nebulae – later identified as galaxies – showed similar emission bands to other stars in our galaxy, with one caveat: the emission bands were uniformly shifted towards longer wavelengths, i.e., towards the red (Slipher, 1915). This phenomenon, known as redshift, was initially attributed to the Doppler effect, which describes the change in the apparent frequency of a wave caused by the relative motion of the source with respect to its observer, or of the observer with respect to the source. If a light source is approaching us, or standing still as we approach it, we will perceive the light at an increased, blueshifted wave frequency. On the other hand, if the object is moving away, or standing still as we move away, the light will reach us at a lower frequency (redshifted). Also, the redshift or blueshift increases with the speed at which the object is moving away or towards us. The Doppler effect also affects sound and is responsible for the fact that we hear the sound of an ambulance at a much higher pitch when it is approaching us than when it is moving away.
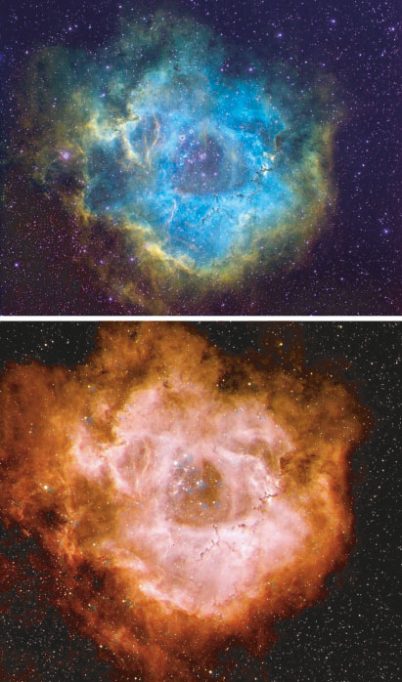
Figure 6. The Rosette Nebula (NGC 2237). The upper image was obtained by combining broad- and narrow-band data, using the Hubble palette to assign the colour. To obtain the lower image, only the information from the RGB (broadband) filters was used. / F. Ábalos Vázquez
In the mid-19th century, there was no reason, in principle, to assume any pattern in the motion of the universe: it was expected that some nebulae (which were actually other galaxies) would be redshifted, while others would be blueshifted. However, the observation of a consistent redshift and its quantification for a large number of celestial objects allowed Edwin Hubble to conclude that the universe was expanding, with all its galaxies and clusters moving away from each other at a rate directly proportional to the distance between them (Hubble, 1929; Hubble & Humason, 1931). The later formulation of Einstein’s theory of general relativity made it possible to understand why the attribution of redshift to the Doppler effect gave incorrect results when applied to very distant galaxies: in fact, the stretching of the wave is caused by the expansion of space-time itself between the emitter and the receiver, which stretches the wave (i.e., reduces its frequency) as it travels (Bunn & Hogg, 2009; Harrison, 1993).
For more distant objects (moving away at higher speeds), the redshift is so pronounced that the emission and absorption lines are observed beyond the red area of the spectrum, in the infrared area. As a result, instruments such as telescopes, lenses, mirrors and cameras need to be particularly sensitive to infrared radiation. To study the farthest (and oldest) parts of the visible universe, telescopes with gold-plated mirrors, rather than silver-plated or aluminised ones, are used. Gold reflects infrared radiation much more effectively than other metals.
Another vital consideration for infrared photography is to cool the sensor and all the electronics to temperatures as close to absolute zero as possible (otherwise their heat will mask the infrared radiation from the object being photographed). There are observatories on Earth that work in the infrared spectrum (and even amateurs working in the infrared), but the most important telescopes dedicated to this work are in space. There are two main reasons for this: firstly, their extra-atmospheric location eliminates the distorting effect of the atmosphere itself, and secondly, it is easier to keep the sensing equipment sufficiently cool there than it is on Earth (as long as we keep the instruments protected from direct solar radiation). A recent example is the recently launched James Webb Space telescope, equipped to study what the universe was like billions of years ago (Böker et al., 2022; Gardner et al., 2006). The hexagonal mirrors that make up the telescope’s reflector are gold-plated to observe the most distant and oldest objects in the universe, which will undoubtedly be in the infrared part of the spectrum. James Webb was launched in December 2021 and the first images arrived in July 2022. Among them was a photograph of a tiny fraction of the visible sky in the southern hemisphere, revealing a veritable symphony of thousands of galaxies. Most of these galaxies appear as they did some 4.6 billion years ago (shortly after the formation of the solar system), and some are distorted (or even mirrored) by the gravitational lensing effect of the central galaxy cluster. These images have undoubtedly marked a turning point in the history of astronomy, and yet, in all likelihood, the best is still yet to come.
A key tool in the hands of citizens
The rapid development of technology (and in particular the refinement of imaging detectors) over the last hundred years has been a key factor in the progress of astronomical research, surpassing even the development of telescope optics. The level of sophistication has been such that the construction of large telescopes has become less and less relevant because of the high investment required compared to the benefits offered by state-of-the-art instrumentation coupled to a more modest telescope.
At the same time, cheaper technology has sparked a proliferation of astronomical research projects open to the general public (citizen science projects). Areas of research where the contribution of images from amateur astronomers is particularly important include asteroid tracking, the discovery of new comets, detection of exoplanets, and even measurement of the emission spectra of some celestial objects (Henden et al., 2009).
Over the last century, digital photography has established itself as a key tool in astronomical research and it seems that, far from slowing down, the technological improvement will gain momentum in the coming years, likely bringing a trail of discoveries about the origin of the universe, its size and expansion, and the existence of other habitable (or even inhabited!) planets.
Note
All the astronomical photographs in this article were taken by Fernando Ábalos Vázquez from the AstroCamp Observatory in Nerpio (Albacete) using a 130 mm refracting telescope and a cooled CCD camera.
References
Benneke, B., Wong, I., Piaulet, C., Knutson, H. A., Lothringer, J., Morley, C. V, Crossfield, I. J. M., Gao, P., Greene, T. P., Dressing, C., Dragomir, D., Howard, A. W., McCullough, P. R., Kempton, E. M. R., Fortney, J., & Fraine, J. (2019). Water vapor and clouds on the habitable-zone sub-Neptune exoplanet K2-18b. The Astrophysical Journal Letters, 887(1), L14. https://doi.org/10.3847/2041-8213/ab59dc
Böker, T., Arribas, S., Lützgendorf, N., Alves de Oliveira, C., Beck, T. L., Birkmann, S., Bunker, A. J., Charlot, S., de Marchi, G., Ferruit, P., Giardino, G., Jakobsen, P., Kumari, N., López-Caniego, M., Maiolino, R., Manjavacas, E., Marston, A., Moseley, S. H., Muzerolle, J., … Zeidler, P. (2022). The near-infrared spectrograph (NIRSpec) on the James Webb Space Telescope. III. Integral-field spectroscopy. Astronomy & Astrophysics, 661, A82. https://doi.org/10.1051/0004-6361/202142589
Bryson, S., Kunimoto, M., Kopparapu, R. K., Coughlin, J. L., Borucki, W. J., Koch, D., Aguirre, V. S., Allen, C., Barentsen, G., Batalha, N. M., Berger, T., Boss, A., Buchhave, L. A., Burke, C. J., Caldwell, D. A., Campbell, J. R., Catanzarite, J., Chandrasekaran, H., Chaplin, W. J., … Zamudio, K. A. (2021). The occurrence of rocky habitable-zone planets around solar-like stars from Kepler data. The Astronomical Journal, 161(1), 36. https://doi.org/10.3847/1538-3881/abc418
Bunn, E. F., & Hogg, D. W. (2009). The kinematic origin of the cosmological redshift. American Journal of Physics, 77(8), 688–694. https://doi.org/10.1119/1.3129103
Cassinello Espinosa, A. (2019). La medida del cielo: Momentos estelares en las ciencias del cosmos. Escolar y Mayo Editores S. L.
Gardner, J. P., Mather, J. C., Clampin, M., Doyon, R., Greenhouse, M. A., Hammel, H. B., Hutchings, J. B., Jakobsen, P., Lilly, S. J., Long, K. S., Lunine, J. I., Mccaugherean, M. J., Mountain, M., Nella, J., Rieke, G. H., Rieke, M. J., Rix, H., Smith, E. P., Sonneborn, G., … Wright, G. S. (2006). The James Webb space telescope. Space Science Reviews, 123(4), 485–606. https://doi.org/10.1007/s11214-006-8315-7
Harrison, E. (1993). The redshift-distance and velocity-distance laws. The Astrophysical Journal, 403, 28–31.
Henden, A. A., Welch, D. L., Terrell, D., & Levine, S. E. (2009). The AAVSO photometric all-sky survey (APASS). American Astronomical Society Meeting Abstracts, 214, 402–407.
Hubble, E. (1929). A relation between distance and radial velocity among extra-galactic nebulae. Proceedings of the National Academy of Sciences, 15(3), 168–173. https://doi.org/10.1073/pnas.15.3.168
Hubble, E., & Humason, M. L. (1931). The velocity-distance relation among extra-galactic nebulae. The Astrophysical Journal, 74, 43–80. https://doi.org/10.1086/143323
Huggins, W., & Miller, W. A. (1864). On the spectra of some fixed stars. Philosophical Transactions of the Royal Society of London, 154, 413–445. https://doi.org/10.1098/rstl.1864.0012
Leavitt, H. S., & Pickering, E. C. (1912). Periods of 25 variable stars in the Small Magellanic Cloud. Harvard College Observatory Circular, 173, 1–3.
Libby-Roberts, J. E., Berta-Thompson, Z. K., Désert, J.-M., Masuda, K., Morley, C. V., Lopez, E. D., Deck, K. M., Fabrycky, D., Fortney, J. J., Line, M. R., Sanchis-Ojeda, R., & Winn, J. N. (2020). The featureless transmission spectra of two super-puff planets. The Astronomical Journal, 159(2), 57. https://doi.org/10.3847/1538-3881/ab5d36
Mayor, M., & Queloz, D. (1995). A Jupiter-mass companion to a solar-type star. Nature, 378(6555), 355–359. https://doi.org/10.1038/378355a0
Petigura, E. A., Howard, A. W., & Marcy, G. W. (2013). Prevalence of Earth-size planets orbiting Sun-like stars. Proceedings of the National Academy of Sciences of the United States of America, 110(48), 19273–19278. https://doi.org/10.1073/pnas.1319909110
Rossiter, M. W. (1980). “Women’s work” in science, 1880-1910. ISIS, 71(3), 381–398. https://doi.org/10.1086/352540
Shapley, H., & Curtis, H. D. (1921). The scale of the universe. Bulletin of the National Research Council, 2(11), 171–217. https://archive.org/details/scaleofuniverse00shap
Slipher, V. M. (1915). Spectrographic observations of nebulae. Popular Astronomy, 23, 21–24.
Taton, R., & Curtis, W. (1995). Planetary astronomy from the Renaissance to the rise of Astrophysics: Part B: The Eighteenth and Nineteenth centuries. Cambridge University Press.