In modern ecology, the traditional diversity indices (usually of richness, abundance, and species evenness) have been highly revealing and useful for monitoring community and ecosystem processes. However, around two decades ago, a pioneering research team noticed that these indices did not completely resolve their open questions. Thus, they suggested changing the way biodiversity was measured. At its base, this new methodology considers the distance between species (in phylogenetic or functional terms) before subsequently applying the appropriate biodiversity indices. Including phylogenetic and functional elements in the evaluation of diversity allows us to approach the concept of biodiversity in a more comprehensive way.
Keywords: classical diversity indices, functional diversity, phylogenetic diversity, functional traits, genetic distances.
Biodiversity, or biological diversity, is a concept that refers to the variety of life present on Earth as a result of thousands of millions of years of evolution. What probably first comes to mind when we hear this word are idealised scenarios: tropical rain forests full of green, woody, and lush trees, populated by exotic mammals and birds. We might even include some flashy insects in our mental picture, like colourful butterflies. Or perhaps we imagine a coral reef with fish swimming around and combining into impossible colours. However, the «evolutionary» dimension of the term makes us suspect that there must be something else to this scenario.
«One of the fundamental pillars to managing biodiversity is to reliably quantify it while taking organisation levels into account»
Life on Earth comprises many plant and animal groups, but also contains many eukaryotic groups (organisms whose cells have a nucleus), and even more prokaryotic groups (organisms whose cells do not have a nucleus). All these forms of life are protagonists in the ecosystem processes, and these processes have made understanding environmental biodiversity a constant concern for humans. Firstly, to find uses for them or to extract their resources; secondly, to protect them for reasons beyond mere utilitarianism, which thus brings a more eudaemonic dimension to this conservation; and lastly, in recent decades, to evaluate and mitigate the impact of climate-change related disturbances to our planet’s life. Biodiversity encompasses variability at three different levels: «between ecosystems»; between the taxonomic units (hereon in species)1 inhabiting the ecosystems («interspecific»); and among each species, in other words, «intraspecific» (Glowka, Burhenne-Guilmin, Synge, McNeely, & Gündling, 1994). Therefore, one of the fundamental pillars to managing biodiversity is to reliably quantify it while taking these organisation levels into account.
The spatio-temporal decomposition of biodiversity
Historically, ecologists soon became aware that biological variability can present different patterns depending on the scale at which it is analysed. Whittaker (1960) was the first to describe the different spatial components in which biodiversity can be measured; he proposed dealing with the study of biodiversity along several hierarchical spatial scales (Figure 1). Thus, he defined gamma diversity (γ) as the diversity of species within a region or ecosystem. In contrast, the lowest hierarchical scale, corresponding to the sampling point, was called alpha diversity (α). Lastly, he defined beta diversity (β) – which establishes the dissimilarity between two comparable modules, normally within the same hierarchical level – as the dissimilarity in biodiversity between several sampling points.
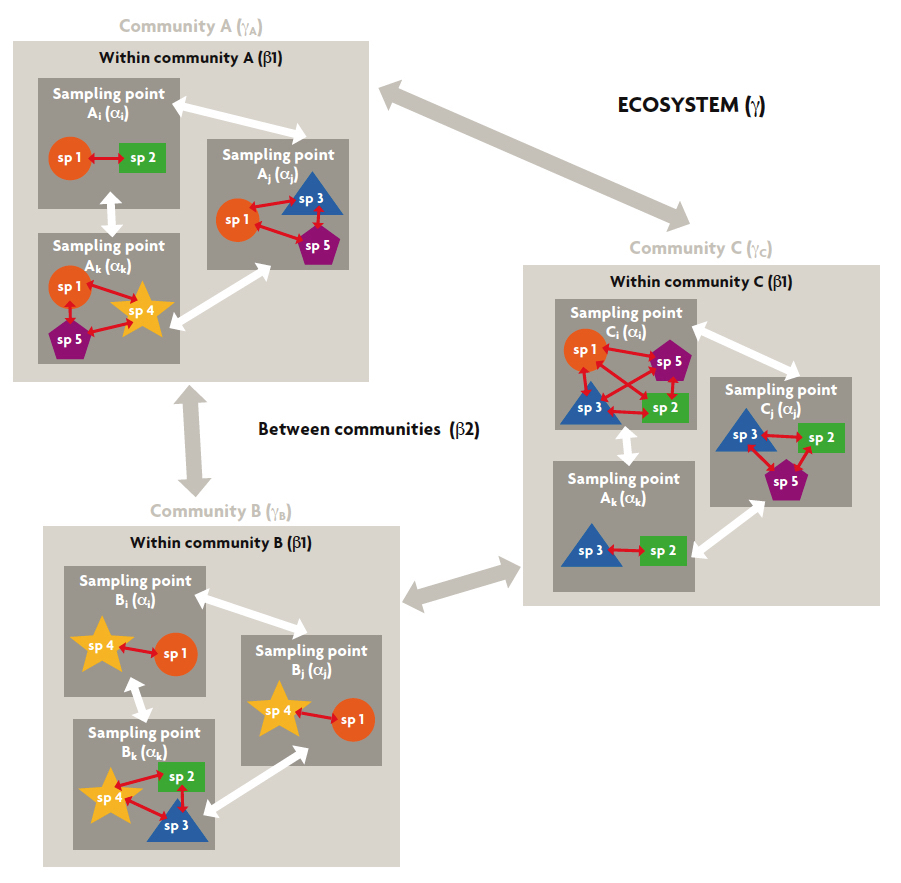
Figure 1. Biodiversity can be measured by considering different scales, among them spatial scales. The diagram shows an example of the different spatial components in which biodiversity can be measured, considering an ecosystem comprising three communities (A, B, C). In each community, the species (sp.) present have been registered at three sampling points (i, j, and k). Gamma diversity is the diversity of species in the ecosystem (γ) or community (γA, γB, γC). The diversity at the sampling point is called alpha diversity (α). Beta diversity 1 (β1) is the dissimilarity between sampling points within the same community and beta diversity 2 (β2) is the dissimilarity between the communities in an ecosystem. White and grey arrows refer to the differences measured by the biodiversity indices between the sampling points or communities required to calculate the beta 1 and 2 components, respectively. Red arrows indicate the possibility of calculating the distance between species (in terms of genetic or functional distances) before measuring biodiversity.
Because of its usefulness and extensive use, the beta component was later redefined. Thus, as shown in Figure 1, he distinguished between beta diversity 1 (β1) – the dissimilarity between sampling points within the same community – and beta diversity 2 (β2) – the dissimilarity between the communities in a region (Excoffier, Smouse, & Quattro, 1992). The most recent studies in the field have proposed that biodiversity can be decomposed over time, in an analogous way to spatial decomposition. In this way, the hierarchical scale could be extended to nested time modules, such as years, decades, and centuries. A logical consequence of this design is the possibility of combining the spatio-temporal aspects of biodiversity, but the approach still needs to be thoroughly developed (Pavoine & Bonsall, 2011).
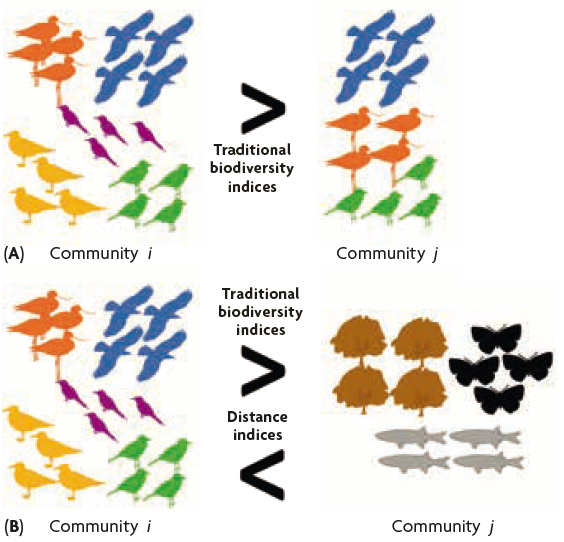
Figure 2. A and B show two communities with the same abundance for all the species present, but with higher species richness in community i than in community j in both cases. However, species have been replaced by other phylogenetically or functionally distant species in community j of the figure B. According to traditional indices, community i is more diverse than community j both in (A) and (B). While according to distance indices (phylogenetic diversity and functional diversity), community j is more diverse than community i in (B).
How do we measure biodiversity?
Regardless of the spatio-temporal scale (α, β, γ), the traditional indices that quantify and characterise diversity have primarily been based on evaluating variability at the «interspecific» level because it is much easier to observe and quantify there. Conversely, the «intraspecific» and «ecosystem» diversities have enjoyed much less attention. Traditional biodiversity indices mainly quantify the richness, abundance, and evenness of species in a sample. Thus, for a given sample defined in a spatial or time scale, the richness of species indicates the number of species that are present, the abundance quantifies the number of individuals of each species and, lastly, the evenness connects richness and abundance to establish the degree to which the individuals are distributed among all the species in the sample. Thanks to these traditional indices, we were able to easily and intuitively characterise biodiversity at any spatial scale (α and γ) and even compare modules at the same hierarchical level (β).
Nonetheless, these indices do not offer all the nuances required to obtain a complete idea of biodiversity, because they neglect two of its dimensions: phylogenetics and function. For instance, if we use traditional indices with two communities (community i and community j, as we can see in Figure 2a) with the same abundance for all the species present, and species richness of Si = 5 and Sj = 3, the evenness will be Ei = 100 % and Ej = 100 %.
However, as shown in Figure 2b, when we replace the species in community j with others that are different phylogenetically (genetically) or functionally (other species that occupy different niches and provide very different services in the ecosystem), the traditional biodiversity indices will still provide the same relative results. In other words, community i will be more diverse than community j, without considering how different the species in the communities are from each other. This example clearly shows a fundamental limitation in the traditional biodiversity indices. Therefore, in recent decades, many ecologists have been trying to define a new mathematical framework to describe the phylogenetic and functional differences in the species in a community.
Among the earliest approaches, Faith (1992) tried to evaluate and consider the phylogenetic distance between species. He argued that, before measuring the biodiversity in a given sample, the phylogenetic distance between the species that make up such a sample should be calibrated. Thus, we could know the evolutionary uniqueness of each lineage (whether they had diverged earlier or later from each other). Thus, he proposed measuring the phylogenetic relationship between the species in a sample as a matrix that compared pairs of species. This matrix is extracted from the distance between each pair of species in a phylogenetic tree. In this way, by studying phylogenetic diversity, we can refer to any analysis that bases its measurement of biodiversity on the phylogenetic distance between species.
«Ecologists soon became aware that biological variability can present different patterns depending on the scale at which it is analysed»
Later, Petchey and Gaston (2002) proposed a protocol that was similar to Faith’s (1992), but in this case the relationships between species were not constructed using phylogenetic sequences, but rather, functional traits.2 Functional traits are the units used to measure functional diversity in a group of species and allow us to evaluate the consequences of a wide variety of ecological questions; e.g., the impact of climate change on diversity or ecological succession after the restoration of a habitat. In this case, the functional complementarity between the species in our sample would be measured to build a matrix showing the distance between each pair of species using data about their functional traits. Cross-referencing this matrix with the appropriate biodiversity index, we can understand how functionally diverse our sample is.
Finally, if we re-examine Figure 2b, but before measuring the biodiversity of each sample we calibrate the distance between the species in our communities in terms of their phylogenetic or functional-diversity distance, we will reach a completely different conclusion about which one is the most diverse community.
What do these studies provide?
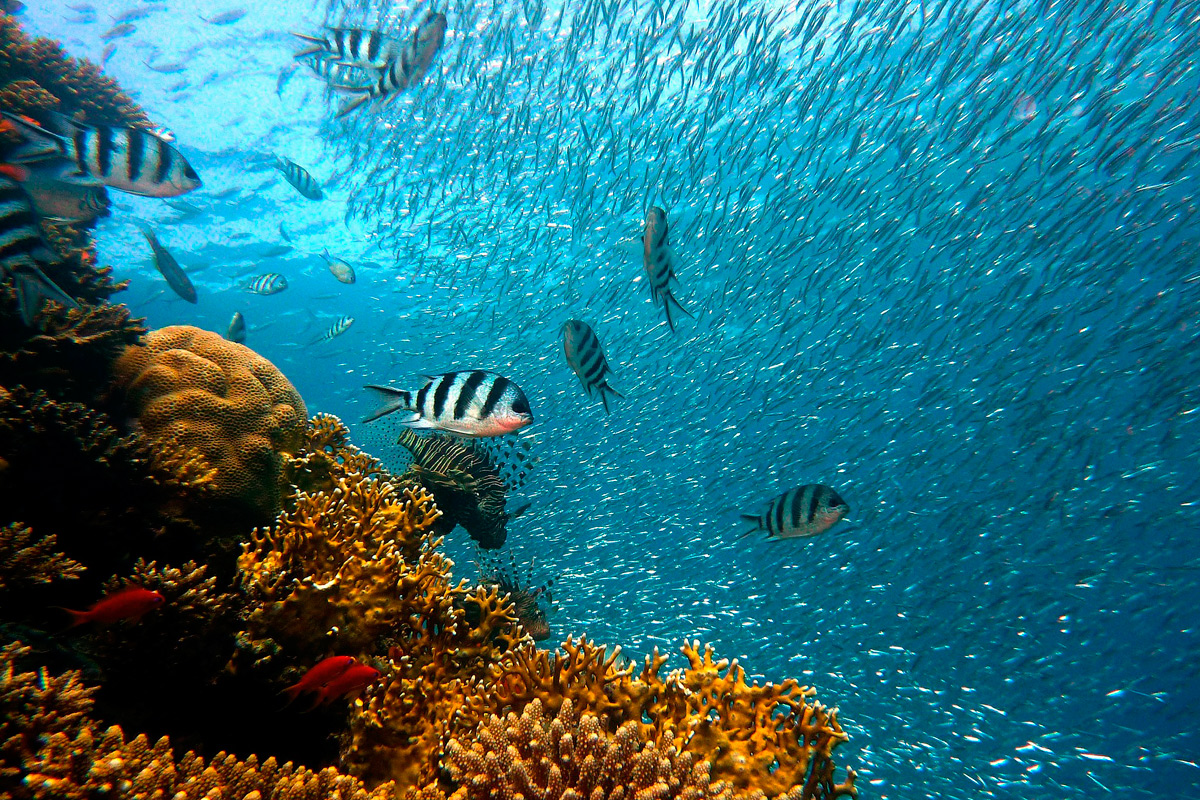
In recent studies we can find remarkable claims; for instance, that a flamboyant coral reef is less biodiverse than an austere mountain ecosystem (Figure 3). While the former was favoured by radiation or emergence of new species, each of these are very close in phylogenetical terms and almost functionally identical. Therefore, if we add or remove a species from the ecosystem, its phylogenetic or functional diversity values will remain almost the same. Conversely, the number of species in the mountain ecosystem is lower, but these species are very distant in phylogenetic and functional terms, so losing one of them would lead to a dramatic decrease in its phylogenetic or functional diversity values.
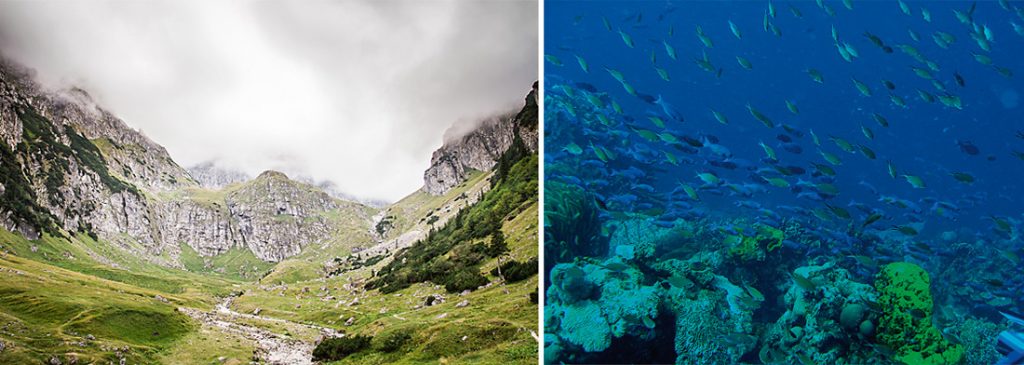
Figure 3. According to the traditional diversity indices, the fish community in a coral reef (on the right) would be more biodiverse than an entire mountain ecosystem (on the left) because it has a larger number of species. However, these species are phylogenetically (evolutionarily) and functionally (ecologically) similar, so they are redundant in terms of phylogenetic and functional diversity. Conversely, in the mountain ecosystem, even though there are fewer species, each of them is phylogenetically and functionally different from each other.
With this we do not mean that a coral ecosystem is less deserving of conservation than a high mountain one. However, we do want to convey that the correct consideration of the functional and phylogenetic aspects of biological communities can help us to understand the biodiversity structure of the planet better, and so these elements should be taken in to account when establishing specific conservation measures.
Next stop?
Carrying out these studies is more complex than with the traditional approaches because they require two challenges to be dealt with. The first is the identification of significant and non-redundant functional traits to quantify functional diversity; the second is the availability of information about the kinship between species for use in the quantification of phylogenetic diversity. Interestingly, however, unlike traditional biodiversity indices, the concepts of phylogenetic and functional diversity are directly applicable at the individual level. Although less explored, this approach allows us to extend our studies to cover intraspecific diversity, which means that this aspect can be integrated into biodiversity studies. For instance, measuring intraspecific phylogenetic diversity could be essential to understanding phylogeographic patterns and to recognising subspecies so that biological conservation plans can be properly implemented (Excoffier, 2008).
«In recent studies we can find remarkable claims; for instance, that a flamboyant coral reef is less biodiverse than an austere mountain ecosystem»
In addition, phylogenetic and functional diversity indices have been useful in the characterisation of a many terrestrial and aquatic ecosystems, using everything from herbaceous or woody plants to insects and vertebrates as models. Nevertheless, many fields in which these analyses can be applied are still likely to remain. For example, because parasites depend on other organisms, they have traits that make them useful in the revelation of hidden ecosystem processes. Moreover, parasites are omnipresent in ecosystems; some have complex life cycles, so they are useful for tracing food-web pathways and for discovering spatio-temporal patterns (Poulin & Morand, 2000). Despite this, very few authors have tried to study biodiversity in parasite communities from the phylogenetic or functional point of view, although some recent studies indicate that parasitic organisms fulfil regulation, protection, and stability functions in ecosystems. Moreover, because of the nested structure of parasitic communities, studying parasite-host systems3 provides powerful comparative instruments which can offer generalisable conclusions about other biological communities.
Conclusion
It is currently difficult to imagine a study trying to explain or predict the processes that take place in ecosystems not using phylogenetic or functional data from the taxonomic units considered in the sample. However, we would like to point out that studies based on comparing results obtained using different biodiversity indices, as well as those performed at different hierarchical scales, can reveal evolutionary, biogeographical, or radiation processes that would otherwise go unnoticed. Therefore, we invite interested researchers to use this new conceptual framework in their studies.
1. In the text we simplify the description of taxonomic units, equating them merely to the description of biological species. However, we must note that biodiversity indices, both traditional ones and those based on phylogenetic or functional differences, can be applied to any level of the taxonomic classification of organisms, even to viruses (Shi et al., 2016), which in some ways escape the normal definition of a biological organism. (Go back)
2. According to Carmona, De Bello, Mason, and Lepš (2016), a functional trait is any morphological, physiological, phenological, or behavioural trait that can be measured at the individual level and which affects survival or reproduction. (Go back)
3. The analysis of nested groups (for instance, parasite-host associations) can reveal non-random ecological patterns and are useful exploratory tools that can be used to suggest which mechanisms might structure a given community (González & Poulin, 2005). (Go back)
References
Carmona, C. P., De Bello, F., Mason, N. W. H., & Lepš, J. (2016). Traits without borders: Integrating functional diversity across scales. Trends in Ecology & Evolution, 31(5), 382–394. doi: 10.1016/j.tree.2016.02.003
Excoffier, L. (2008). Analysis of population subdivision. In D. J. Balding, M. Bishop, & C. Cannings (Eds.), Handbook of statistical genetics (pp. 980–1020). Chichester: John Wiley & Sons Ltd. doi: 10.1002/9780470061619.ch29
Excoffier, L., Smouse, P. E., & Quattro, J. M. (1992). Analysis of molecular variance inferred from metric distances among DNA haplotypes: Application to human mitochondrial DNA restriction data. Genetics, 131(2), 479–491.
Faith, D. P. (1992). Conservation evaluation and phylogenetic diversity. Biological Conservation, 61(1), 1–10. doi: 10.1016/0006-3207(92)91201-3
Glowka, L., Burhenne-Guilmin, F., Synge, H., McNeely, J. A., & Gündling, L. (1994). A guide to the convention on biological diversity (N.º 333.95 G946). Gland/Cambdrige/Bonn: IUCN and Environmental Law Centre IUCN.
González, M. T., & Poulin, R. (2005). Nested patterns in parasite component communities of a marine fish along its latitudinal range on the Pacific coast of South America. Parasitology, 131(4), 569–577. doi: 10.1017/S0031182005007900
Pavoine, S., & Bonsall, M. B. (2011). Measuring biodiversity to explain community assembly: A unified approach. Biological Reviews, 86(4), 792–812. doi: 10.1111/j.1469-185X.2010.00171.x
Petchey, O. L., & Gaston, K. J. (2002). Functional diversity (FD), species richness and community composition. Ecology Letters, 5(3), 402–411. doi: 10.1046/j.1461-0248.2002.00339.x
Poulin, R., & Morand, S. (2000). The diversity of parasites. The Quarterly Review of Biology, 75(3), 277–293. doi: 10.1086/393500
Shi, M., Lin, X. D., Tian, J. H., Chen, L. J., Chen, X., Li, C. X., ... Zhang, Y.-Z. (2016). Redefining the invertebrate RNA virosphere. Nature, 540(7634), 539–543. doi: 10.1038/nature20167
Whittaker, R. H. (1960). Vegetation of the Siskiyou Mountains, Oregon and California. Ecological Monographs, 30(3), 279–338. doi: 10.2307/1943563