
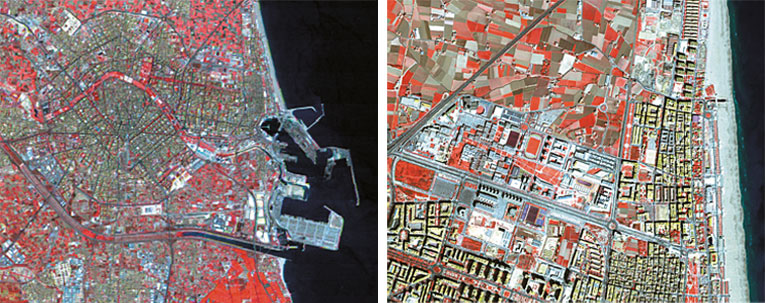
Figure 1. Satellite images. Differences between a) a Landsat TM image from 2005 and b) a QuickBird image from 2004 of the north of the city of Valencia. Both images show a combination of false-colour bands. We can observe the large difference in spatial resolution between them. |
||
|
Advances in cartography: towards the third dimension The last fifteen years have witnessed an authentic revolution in the field of cartography, and especially in the three-dimensional characterization of the territory. Technological advances are changing not only the tools and sources to learn about geographical reality but also the way to study it, now with a detail that was unexpected a few years ago. This, however, does not affect only specialists; anyone can clearly see this revolution: you just have to access Google Earth with your personal computer to visit any place in the world and have a three-dimensional view with a truly overwhelming accuracy. The change we are living is founded, undoubtedly, on the technological improvements in recent decades, both in the field of geographical positioning – sustained largely by global positioning systems provided by artificial satellites and advances in geodesy – and in the field of massive geographic data acquisition – with the development of increasingly accurate and powerful airborne sensors – and in their management, with the development of geographic information systems (GIS). However, the data recorded by the new information capture systems is very similar to that recorded traditionally by topographers. So, much of the geographic information that surprises us today because of its availability already existed many years ago in traditional topographic maps. What has really changed? From our perspective, basically three things have changed: the way in which we now obtain the information, the level of accuracy and the amplitude of the geographic space covered. New topographic data collection systems The revolution we are living began with the improvement of data capture. The traditional topographic and photogrammetric methods to locate each point with planimetry and altimetry have progressed substantially and, at the same time, new methods have been developed that would have been unthinkable a few years ago. The spread of aerial photography for spatial analysis starting in the 1960s led to a qualitative leap that allowed us to move from isolated information obtained with great effort on the field, to the direct observation of the territory. Thematic cartography multiplied due to the possibility of collecting very different information in time and space. Moreover, in the 1980s, satellite imagery that was previously restricted to military purposes began to be disseminated. Sensors were able to capture electromagnetic radiation in different bands, so we were also able to obtain, besides visible spectrum images, other infrared and even microwave (radar) images. The spectral accuracy (three or four bands of the electromagnetic spectrum), radiometric accuracy (used to differentiate about 255 digital levels or levels of grey in an image), spatial accuracy (hundreds of metres) and temporal accuracy (weeks) of the first satellites improved substantially over time and today there are several generations of sensors (Ikonos, Orb-View, SPOT 5, QuickBird, AVIRIS, CASI, ASTER…) that acquire information from dozens of channels with a spatial resolution lower than a metre (which in restricted military applications can be of 20-30 cm), differentiating thousands of digital levels and with a frequency of hours (Figure 1). |
«Technological advances are changing not only the tools and sources to learn about geographical reality but also how to study it» |
|
|
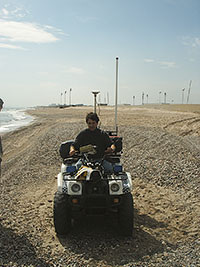
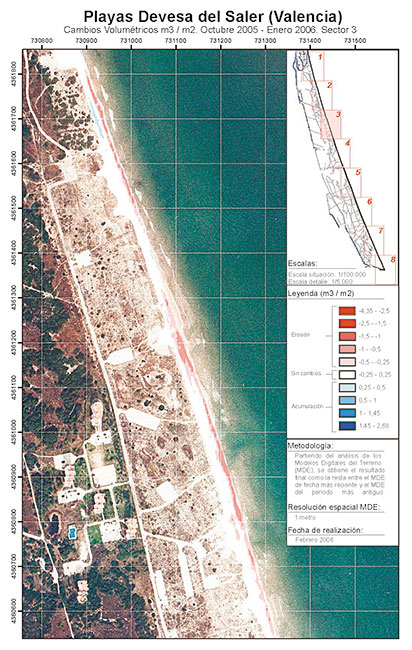
One of the oldest objectives of cartography is the exact location of objects. Georeferencing, which was previously achieved only with topographic methods, can be achieved today by means of GPS (global positioning systems). It is a system created by the U.S. Department of Defense based on determining the position of any place where we place an antenna by means of the difference of positions with respect to different satellites that orbit the Earth and whose exact position is known at any moment. This procedure allows us to locate an object by referring it to a universal reference system (WGS84) that, at the same time, can be exported to the national reference systems, in our case the ED50, and to the most suitable cartographic projection, which to us would usually be the UTM (Universal Transverse Mercator). The location of the twenty-four satellites, which continuously orbit the Earth, is controlled by monitoring stations. The position of an object is calculated by measuring the distance that separates it from at least three satellites, though four satellites are needed for greater accuracy. This operation is done by calculating the time it takes a radio signal emitted by the satellite to reach the GPS receiver. Since nowadays we know the speed of sound, we can calculate the distance that separates us from the satellites. Today GPS receivers can incorporate digital maps that allow us to track a path and know a position at any time. Applications for air, maritime and terrestrial navigation are immense and the use of GPS receivers has become habitual. The intrinsic accuracy of the GPS system, without correction and with eight satellites, ranges between six and fifteen metres. This accuracy, more than sufficient to locate an object, has been enhanced in order to be exploited scientifically. Thus, using real time differential global positioning systems (known as RTK-GPS) it is possible to immediately determine the coordinates of the point where the signal receiver is located with a degree of accuracy lower than ± 5 cm in planimetry and ± 10-15 cm in altimetry. This, for example, allows us to make very quick and accurate measurements of changing spaces, such as tracking changes in beaches or dunes, surveying them with just a quad (Figure 2) and then measuring changes (Figure 3). This is a good way to boost topographically relatively small and/or changing areas because it is accurate, fast and cheap. For larger areas we can already use measurement systems managed from aircrafts. In this sense, laser rangefinders have revolutionized the way of obtaining topographic data. Airborne LiDAR (acronym for Light Detection and Ranging) is a system that consists of a laser rangefinder and a mirror that deflects the light beam perpendicular to the aircraft’s trajectory. This lateral displacement combined with the aircraft’s makes it possible to scan the land below. The system measures the distance of the sensor to the ground based on the time it takes for the light beam to reach the ground and return to the sensor. If the coordinates of the aircraft are known at any moment (which is achieved with a differential GPS system based on an inertial system, which determines the change of position), as well as the angle of the mirror, we can calculate the coordinates of each point that receives laser signals. The result of a LiDAR flight is a collection of accurate coordinates that can reach more than 30,000 points per second. Additionally, for each laser pulse emitted, the sensor can detect the return of up to two echoes (or signals), as well as the intensity of the energy reflected. With the two echoes registered for each signal, two different data are obtained: the first marks the position of the first element found, which may not necessarily be the ground, but a tree or any other object in the earth’s surface; the second – more energetic – is the signal reflected by the solid surface below. The result of the processing of these two data sets are two digital terrain models (DTM): one is the digital elevation model (i.e., a model of the heights and elevations of the surface, though not always perfect because there may be buildings and other objects) and the other is known as digital surface model, which shows the distribution of the elevations of the overlapping elements. Comparing both models can provide extremely valuable information not only for topographic works but also for forest and ecological studies. The resolution of these models can be up to one metre, with a vertical accuracy of ± 15-20 cm and a horizontal accuracy of 0.30-1 m. Another device for the massive acquisition of topographic data is the interferometric synthetic aperture radar (InSAR) that can obtain topographical images of a territory from an aircraft. Short-wave energy pulses emitted by the radar device on the earth’s surface and that return with the signal of the terrain are received by two antennas that record the elevation (z) of accurate geographic coordinates (x, y). The planimetric coordinates are determined by means of differential GPS and inertial systems technology. Images taken with an interferometric radar have special advantages over the other systems as it can register information about the land under any atmospheric conditions – something specially useful for certain intertropical areas where clouds are almost constant – and it is able to obtain ground-level information, going through a dense tree cover. The degree of accuracy, without being as high as that of the LiDAR, allows us to get very detailed results. |
Figure 2. If we put a GPS-RTK mobile antenna on a four-wheeled vehicle, we can quickly record the topographical configuration of a zone. This method has been particularly useful for monitoring morphological changes in very changeable and easily accessible areas such as beaches. «Much of the geographic information that surprises us today because of its availability already existed many years ago in traditional topographic maps» {rokbox tex=| Figure 3. From two MDE of the Saler beach enhanced with GPS-RTK at different times (October 2005 and January 2006) we have obtained the differences and we can see the changes occurred in each place. The spaces with losses are depicted in red, while those with gains are shown in blue. The image also shows an orthophotography as a base to easily locate the phenomena shown. |
|
|
The changes, however, do not only affect the ability to view and analyse the geographical reality in a different way, but also greatly increase detail and precision. Due to the progress made in recent years in the collection of geographical information – and especially topographic information – the main concern of topographers and cartographers today is no longer to acquire more data, but to process quickly and efficiently the mass data obtained. The problem has been solved in part by GIS, complex software that can store information about the territory organized in layers and geographically localised. These systems facilitate the management of this information by manipulating and interrelating it, and they also obtain new information (Figure 4). Simplistically we could state that the SIG functions as a geographical database with alphanumeric information, which is associated with a geographic identifier. This way we can know the attributes or the location of any object. Moreover, since the information is numeric, it enables mathematical operations on different layers. Thus, the location, the observation of temporal and spatial changes, the fulfilment of certain conditions and the creation of new information are some of the usual functions of a GIS. In a GIS we can introduce orthophotos, satellite images, topographic data (contours) and other spatial information (roads, cities, industries, health services, etc.) (Figure 4). This information can be a raster (two dimensional) or a vector (linear or point). Although most GIS are commercial (ArcGIS, MapInfo, Idrisi, Geographics, Miramon, etc.) and paid licensed, there are some free software on the Internet (GIS GRASS, JUMP, gvSIG, SAGA GIS, etc.). Digital Terrain Models Today we have explicit information about the positioning – defined by the three spatial coordinates x, y, z (longitude, latitude and altitude) – of geographical objects, while a few years ago this information was just implicit. What do we mean by this? When users get a topographic map they can deduce, if they can read the contour lines, the height of any spot in the mapped area. They just need to solve – mentally – a simple linear equation. Therefore we can say that those who can read a topographic map can seamlessly recognize what is the relief of a particular place. This recognition, however, is carried out mentally and, therefore, it is not as easy to show it graphically, nor is it easy to operate mathematically with only «mentally» defined reality. Having the information in digital format can make this configuration explicit, which was already implicit in the topographic map. Digital terrain models (DTM) are a set of numerical data describing the spatial distribution of a characteristic of the territory, such as the elevation (in this case we call them digital elevation models, DEM). By having this information in digital format, it is possible to present it more suggestively than in the traditional two-dimensional form of a map. This way, we can make three-dimensional views and it is also possible to shift the position of the point of view, as though we were flying above the three-dimensional virtual reality to which, in addition, we can overlay a detailed picture of the surface and get a very realistic vision: a visit to Google Earth exemplifies what we have said better than any other explanation. The development of this technology owes much to military interests and also to the world of video games. The availability of topographic data on all points of the geographical surface studied, which is the one containing a digital elevation model, also allows us to visualize reality, to extract information directly related to topographic configuration quickly and accurately. For example, it is easy to deduce directly the slope of each point or its orientation, which in part we could obtain from a topographic map. In MDE, however, we can calculate much more difficult data, such as the values of direct solar radiation that each point of a territory can receive over a year (Figure 5) and that until recently was solved by defining a space as being in the sun or shade, or deducting the path of the runoff. All this invites us to include three-dimensional reality into predictive models of natural processes (ecological, hydrological and geomorphological). |
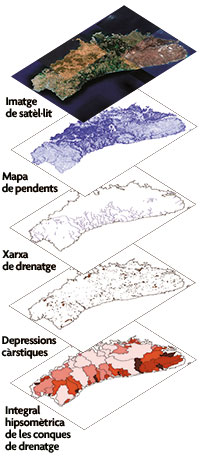
Figure 4. Structure of a GIS of the island of Menorca, consisting of a satellite image, a slope map, a layer with the drainage network, another with karstic depressions and another referring to the hypsometric integral of drainage basins. «The main concern of topographers and cartographers today is to process the mass data obtained quickly and efficiently» |
|
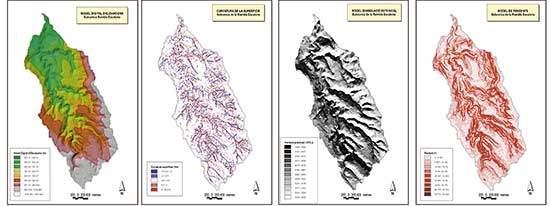 Figure 5. The figure shows four digital terrain models. The digital elevation model shows the distribution of elevations or heights of the terrain. The model of the curvature of the surface represents concave and convex inflections, coloured in blue and red, respectively. The model of potential annual insolation shows values of the different distribution of solar energy over a year. To do this, we have calculated the position of the sun at each hour of one day every fifteen days and for each position of the sun we have assessed how much energy each cell of the model will receive (in this case of 10 x 10 metres) and what terrain points will be illuminated by the sun or will stay in the shade as the effect of the orography. Finally, all data spanning one year has been integrated. The slopes model shows this topographic variation in degrees. |
||
|
The popularisation of cartography on the Internet A significant change experienced by cartography in the second half of the twentieth century has been democratization. We have moved in a few decades from an almost secret cartography, in the hands of armies or states, and very limited, to a huge availability and even free materials. Over time, servers that facilitate thematic cartography for any user have been created. The servers allow us to view maps, to locate, to identify attributes, to perform simple queries and to connect to remote databases to create thematic maps. On the other hand, topographic cartography and its derivatives are spreading over the Internet. Having topographic information in the form of DEM reduces the need to resort to traditional topographic map sheets. In principle we can join without any difficulty contiguous models, creating a continuous reality, something crucial for many applications, for example, to create the cartography of fields of view from specific positions or to define drainage basins. Can we, therefore, already speak of a continuous map? The answer is yes and no. In fact, the products available are always limited to specific areas; having said that, it is true that we have information about almost every landmass on the planet. For eleven days in February 2000, a NASA space shuttle performed a topographic survey of 80% of the Earth’s land using interferometric synthetic aperture radar. This project, known as the Shuttle Radar Topography Mission (SRTM), led by the NASA / NGA, has allowed us to have an almost global DEM of the planet with a spatial resolution of about ninety meters and with an altimetric accuracy of about sixteen metres that has been made available to the entire scientific and technical community. This near-universal availability of information is opening a window to the continental analysis with data of limited accuracy, but adequate, with a consistent quality and without the limitations imposed by national boundaries. At the same time, for many countries it ends up being the best source of available geographic information. Making a constructive use of all this is, however, everyone’s job. REFERENCES Josep E. Pardo Pascual. Department of Cartographic Engineering, Geodesy and Photogrammetry. Universitat Politècnica de València. |
||
 |}images/stories/numeros/METODE_53/117b-53.jpg{/rokbox}
| Cartography on the Internet
Internet has made cartographic materials available in a few years and, in many cases, for free. Here is a list with some interesting resources. ONLINE SERVERS Commercial servers Public servers based on commercial servers It is a tool oriented to manage geographic information developed by the Department of Infrastructure and Transport of the Valencian government (Generalitat Valenciana). It features a pleasant interface, and it provides quick access to the most common formats, both scanned and vectorial. It integrates in the same view both local and remote data through a WMS, WCS or WFS source. It is aimed at end-users of geographic information, whether professionals or civil servants. It is open source and enables different programmers and specialists to introduce improvements and new extensions for specific applications. Josep E. Pardo Pascual. Department of Cartographic Engineering, Geodesy and Photogrammetry. Universitat Politècnica de València. |