
The Colours of the Universe
Una aproximación a la fotografia astronómica
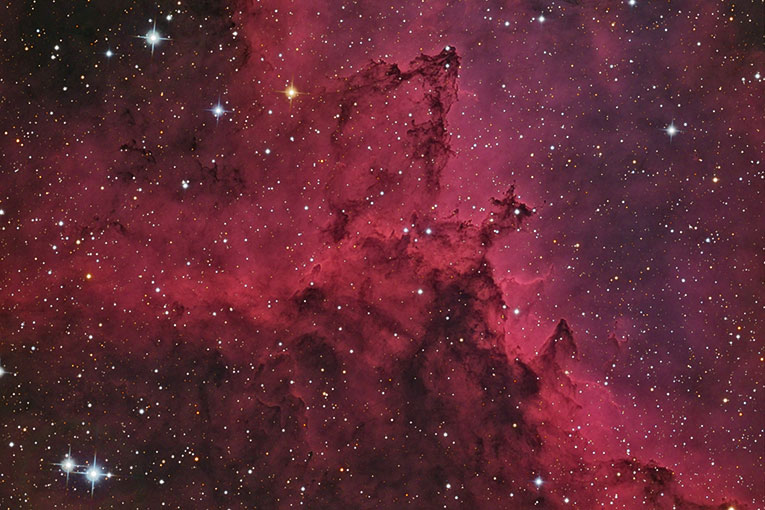
| The vast majority of what we know of the universe we have learned it studying the light coming from incredibly distant objects. Light is but an electromagnetic wave (an oscillation in the electric and magnetic fields propagating through space). When these waves reach our retinas, only if they oscillate at a rate of between 400 and 780 trillion times per second will they be able to produce a signal in our rods and cones that will reach our brain causing us to «see». Therefore, we call «visible spectrum» (Figure 1) to that frequency range. Within these values, each frequency produces a different feeling: for example, light vibrating between 400 and 460 trillion times per second causes us to feel «red» because it affects only one of the three types of cones in our retina (the R-type), which send signals to our visual cortex to produce the aforementioned feeling. | «Each frequency in the visible spectrum corresponds to a colour, but these colours do not exist in the outside world: the brain produces them» | |
 André Oliva André OlivaFigure 1. Light is but an electromagnetic wave (an oscillation in the electric and magnetic fields propagating through space). In the picture, frequency ranges and wavelengths of the electromagnetic spectrum, from radio waves, less charged, to gamma rays, more charged, as well as the visible spectrum in the middle. |
||
|
Each frequency in the visible spectrum corresponds to a colour, but these colours do not exist in the outside world: the brain produces them. From the three types of cones in our retina (R, G and B, for red, green and blue) and the relation between their signals in the visual cortex, we build colours. A wave consisting of a pure frequency that is halfway between red and green, and which stimulates both the R and G type cones alike, produces the feeling of yellow, since R + G = Y (yellow). Similarly, two pure frequencies which only affect type R and type G cones, respectively, will also produce a feeling of yellow. And the same applies to any other combination that stimulates these two cones alike setting aside the third one. Our colour algebra is a base three one because we have three different families of cones in the retina (while rods only detect the presence or absence of light, they do not generate colour sensations but black and white images). However, there are some animals that have many more types of colour receptors in their retinas, like some lizards or birds, with four or five different cones, or squilla matis, a crustacean with sixteen different colour photoreceptors. Literally, these beings can see a range of colours we cannot even imagine. So the question astronomers are often presented with when observing an astronomical picture regarding the « reality» of colours seen in the picture becomes absurd once established that, in fact, there are no colours. We build them, and each species (even each person, to some extent) does so in a different way. What do exist are different vibration frequencies of light, which speak of different phenomena taking place in the universe. Therefore, the way in which we humans see them is only one interpretation, so we can freely make up new visual interpretations in order to strengthen the features we are interested in studying. |
||
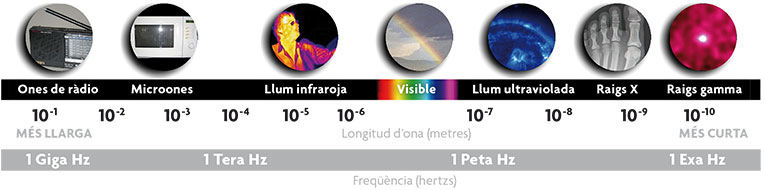
 Fernando Ballesteros i Alberto Fernández Soto Fernando Ballesteros i Alberto Fernández SotoFigure 2. Working with contrast and brightness is one of the first tools of astrophotography in order to make noticeable weaker signals. Above, trio of pictures of galaxy M51, which is not too far away, but is invisible to the naked eye. In a) shown as the naked eye would see it through a telescope; b) shows the same image after being captured with a camera with prolonged exposure; and c) shows the result after processing the brightness levels with a computer. |
||
|
making the inVISIBLE VISIBLE Therefore, the answer to whether we would see the photographed object if we were there would be no, never; not at all. But this should not make us worry. After all, what these astronomical images do is to make visible what is invisible to the naked eye. Besides, we can already do that with regular digital cameras. An ordinary camera tries to match the way our eyes and our brain work. But is their behaviour realistic? Cameras give a linear response, while our eye’s is logarithmic. That means that when we take a picture of the street from within a room, if the exposure time is short, then we will probably get an illuminated outside but the room will look dark. And if the exposure time is longer, the room will be illuminated enough, but the street will be over illuminated. However, in similar conditions, the human eye is capable of seeing both at the same time. Working with contrast and brightness is, in fact, one of the first tools of astrophotography to make weaker signals noticeable. Take, for example, the trio of pictures showing galaxy M51 (Figure 2), a nearby galaxy, however invisible to the naked eye. If we looked through a large telescope, we would see it as the first of the three images (2a): a weak, almost imperceptible and colourless object. This is because when the light intensity is low, the cones are not stimulated and the rods work in our eyes, therefore we see in black and white. As the «exposure time» of our eyes (how long light is accumulated in the retina before sending the signal to the brain) is short, approximately 1/20 seconds, we cannot accumulate much light. But if we use a camera we can accumulate light for as long as we want. So, after five minutes of light gathering, we will see a similar image to the second one (2b), where we can see structures that were previously invisible. Due to the linear response of the camera, the brighter parts of the galaxy are so much brighter than the dimmest areas. This is why we need to process the image with a computer to work with levels of brightness and contrast, and to display all the information in the picture, thus obtaining the final picture (2c). Actually, we have only talked about the intensity of light so far, and about how we can increase or improve it using long exposures or changing responses. But, why limit ourselves to considering intensity only? Just as we have seen, our eyes have three types of cells (each one of them sensitive to red, green or blue), but also digital cameras have three types of detectors inside (Figure 3). In fact, a camera takes three images simultaneously using three different filters (again: red, green and blue) and a programme automatically transforms them so that they reflect every colour we see (or at least as similarly as possible). As we come close to the screen in many devices we can see that the image is actually composed of pixels in three colours only, but our perception joins them together. |
||
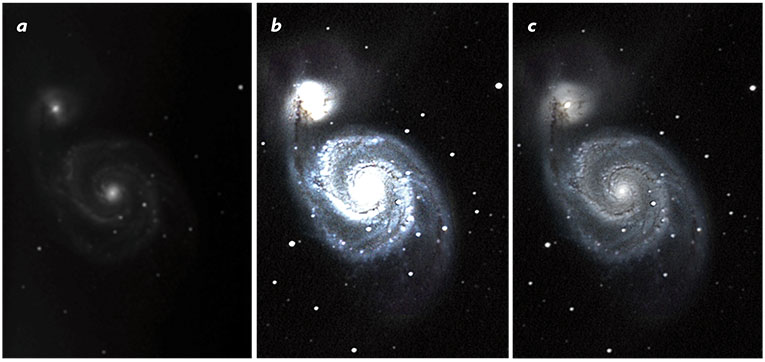
 Peter Halasz Peter HalaszFigure 3.Our eyes have three types of cells (each one of them sensitive to red, green or blue), but also digital cameras have three types of detectors inside. As we come close to the screen in many devices we can see that the image is actually composed of pixels in three colours only, but our perception joins them together. In the picture, from left to right and top to bottom, different geometries of the pixels in a monitor: a cathode ray tube television, a cathode ray tube computer monitor, LCD laptop screen and LCD standard monitor respectively. |
||
|
INFORMAtion and beauty Thus we come to the «first step» in our scale of «falsehood» as we approach the concept of «false colour» used in astronomical images. Astronomers generally do not use colour cameras, but take black and white pictures (i.e. they exclusively measure the intensity of light) but separately and through three different filters: R, G and B (red, green and blue). When reproducing the image we assign the image taken with its own filter to each of the output channels (partial images in red, green and blue), and thus we will see what approximately would be the «real» view of the scene (figure 4). We have to bear in mind that within the image corresponding to a colour there can be mixed information, which can be particularly interesting or worth highlighting. For example, star formation areas emit light in a pure frequency corresponding to 457 trillion oscillations per second: this is the so-called Ha hydrogen emission frequency, located within the red region of the spectrum. This information usually goes unnoticed in an image taken with a standard red filter, so there are specific filters that only let that frequency through blocking the rest of the light, in order to increase its relevance. In the image panel showing a section of Stephan’s Quintet (Figure 5), a compact group of galaxies in the Pegasus constellation, we see four black and white images taken through R, G, B and Ha filters, respectively. The fifth image is a colour composition from only R, G and B images, i.e., similar to what our eyes would see. But in the last picture, also in colour, the red channel has been assigned the sum of the R image plus Ha’s. The resulting picture shows some pink spots that indicate that the lower galaxy has, in different areas of its disk, an active star formation. This information not only has aesthetic value, but is important for astronomers because it shows that this galaxy does not behave like the others in the picture. |
«”Real” vision is not necessarily the best … our eyes are a wonderful tool, but they have their limitations» | |
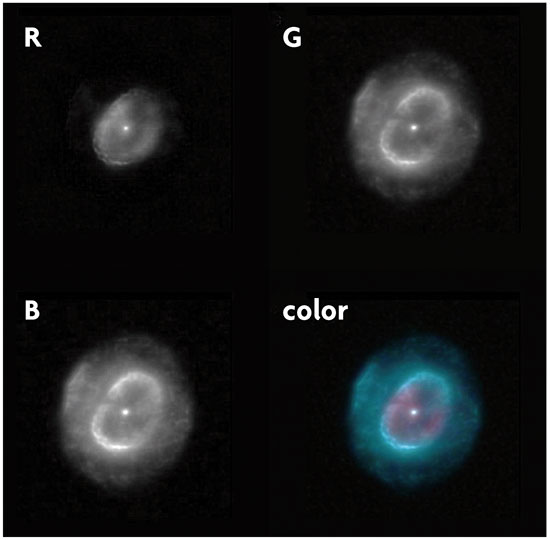 Cortesia de Vicent Peris (Observatori Astronòmic de la Universitat de València) Cortesia de Vicent Peris (Observatori Astronòmic de la Universitat de València)Figure 4. Astronomers generally do not use colour cameras, but take «black and white» pictures. That is, they only measure light intensity, but separately and through three different filters: R, G and B (red, green and blue). When reproducing the image we assign the image taken with its own filter to each of the output channels (partial images in red, green and blue), and thus we will see what approximately would be the «real» view of the scene. Above, black and white images taken through R, G and B filters of the planetary nebula NGC 7662 with the TROBAR telescope from the University of Valencia, and final composition of the three images to generate a colour image. |
||
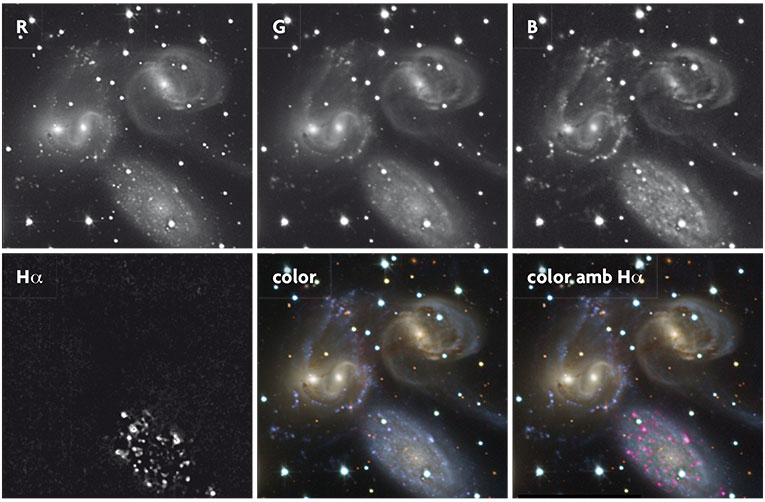 Cortesia de Vicent Peris (Observatori Astronòmic de la Universitat de València) Cortesia de Vicent Peris (Observatori Astronòmic de la Universitat de València)Figure 5. Within the image corresponding to a colour there can be mixed information, which can be particularly interesting or worth highlighting. For example, star formation areas emit light in a pure frequency corresponding to 457 trillion oscillations per second: this is the so-called Ha hydrogen emission frequency, located within the red region of the spectrum. This information usually goes unnoticed in an image taken with a standard red filter, so there are specific filters that only let that frequency through blocking the rest of the light. Above, several images of the Stephan’s Quintet section taken from the Calar Alto Observatory (Almería). The first four are taken with R, G, B and Ha filters respectively (black and white pictures). The fifth is a composition of the colour image using only R, G and B filters. In the sixth one, information from the Ha filter has also been added. This final image is important for astronomers because it shows that the lower galaxy does not behave like the other two. |
||
|
Clearly, «real» vision is not necessarily the best … our eyes are a wonderful tool, but they have their limitations. For example, a sensor in any web camera or mobile phone is a lot more sensitive to the red end of the spectrum. To prove it, we can do the following test: if we point a remote control at webcam or a mobile phone, and press a button, we will see sparkles in the image coming from the remote control. It is infrared light that our eyes do not see, but they are used by the remote to send signals to the machine with which it communicates. The infrared spectrum range includes lots of information useful for astronomers but it is invisible for us. For example, colder stars, or the dust that fills much of our galaxy, emit most of their light in this wavelength. If our cameras can capture it, why not add it to our images? |
||
|
FALSe COLOuR Let’s take a «second step» in the «falsehood» scale. Instead of simply assigning true colours to their corresponding channels, we can be creative and, for example, introduce an infrared image in the red channel of the image. Thus we create an image that would be «real» if our eyes were a little more efficient in that colour range. But once we take this step … we open Pandora’s box. For example, beyond blue there is ultraviolet light, which does not cross the Earth’s atmosphere, so evolution has not «deemed» necessary for us to acquire sensitivity to it, but we can see it perfectly with telescopes in space. While infrared light is emitted by cold objects, ultraviolet light, by contrast, is emitted by very hot or high-energy explosion bodies. We can create a broader view of the universe if we generate, for example, an image that includes an ultraviolet take in the blue channel, making the green channel visible, as well as an infrared take in the red channel. This image would be like the one a hypothetical eye with wide viewing range would have. It is real, though certainly has nothing to do with what we see with our own eyes. Perhaps, come to this point, some readers will think we can still take further steps in the «falsehood scale»… ultraviolet and infrared lights are invisible for us, it is true, but they are energy ranges (or wavelengths) very close to visible light. What about more extreme ranges, such as gamma rays, X rays, microwaves and radio waves? |
«Astronomical images try to make visible what is invisible to the naked eye» | |
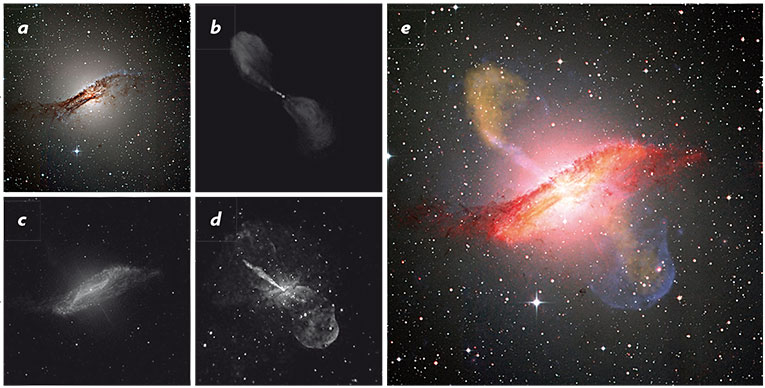 Fernando Ballesteros (Observatori Astronòmic de la Universitat de València) Fernando Ballesteros (Observatori Astronòmic de la Universitat de València)Figure 6.Centaurus A is one of the closest active galaxies to Earth, with a core that emits large amounts of radiation in different bands of the electromagnetic spectrum (radio, infrared, visible light and X-rays). All these components have been taken into account to make the final image, which includes information from six different bands: a) colour image in the visible region, with its three R, G and B channels, taken with the 2.2 metre optical telescope of the European Southern Observatory (La Silla, Chile); b) radio wave image (microwaves to be concrete), taken from Atacama (Chile) with the APEX telescope of the Max Planck Institute, showing two jets of material coming out from the centre of this galaxy, reflecting activity of a massive black hole in the centre. We will assign yellow to this image, so we will equally divide it between the R and the G channel (R + G = Y); c) infrared image taken by the Spitzer Space Telescope, NASA, allowing us to see the intimate structure of the galaxy through the band of dust in the foreground, and which will be added to the R channel; d) X-ray image taken by the Chandra space telescope, NASA, where we can see jets of matter as well as how its ends push and heat the gas surrounding the galaxy, forming two bubbles at its ends. This image will be added channel B. e) The result is a beautiful multi-spectral representation of Centaurus A, in false colour but with no false data, which shows much more information than a colour image in the visible spectrum. |
||
|
Of course, we can combine the colour channels of the images we create in any way we see fit for each situation (Figure 6). Thus we can get to images for which the term «false colour» reaches its fullness: for example, an image in which the blue channel contains data taken in X-rays, the red one includes data from radio waves and the green channel includes information from the ultraviolet range of the spectrum. Again, it is a real image, in the sense that each of them has been taken with a more or less sophisticated light detector and they have not been tampered with at any time. But we need Superman and his X-ray vision or Lieutenant La Forge (Star Trek, The New Generation) and his visor connected directly to the brain, to be able to say «this is how we see with our eyes» (and, why not, adding eye pupils as large as telescopes!). Fernando Ballesteros. Researcher at the Astronomical Observatory of the University of Valencia. |
||