
What do we mean by diversity?
The path towards quantification
The concept of biological diversity has evolved from a simple count of species to more sophisticated measures that are sensitive to relative abundances and even to evolutionary divergence times between species. In the course of this evolution, diversity measures have often been borrowed from other disciplines. Biological reasoning about diversity often implicitly assumed that measures of diversity had certain mathematical properties, but most of biology’s traditional diversity measures did not actually possess these properties, a situation which often led to mathematically and biologically invalid inferences. Biologists now usually transform the traditional measures to the «effective number of species», whose mathematics does support most of the rules of inference that biologists apply to them. The effective number of species, then, seems to capture most (though not all) of what biologists mean by diversity.
Keywords: diversity, effective number of species, Shannon entropy, species richness.
«In spite of its importance in biology, there has been little agreement on what diversity really means or how it should be quantified»
Diversity is both a common buzzword in daily life and a precise scientific concept that arises in many different disciplines. It is one of the fundamental concepts of biology, particularly its sub-disciplines ecology, evolutionary theory, and genetics, but the same concept or a close analogue plays an important role in economics, information theory, and physics, among others. In spite of its importance in biology, however, there has been little agreement on what it really means or how it should be quantified. This kind of issue is always a challenging one for a young science. We could achieve precision of meaning by simply defining diversity in a certain way, but that is a cheap solution; there would be no guarantee that diversity so defined would connect in a deep way to future theories. Instead of establishing a definition of diversity by fiat, biology has gradually been evolving a dynamic diversity concept that addresses a growing number of novel theoretical and practical demands.
«In practice it is almost impossible to accurately count the number of species in rich communities»
Early biodiversity measures
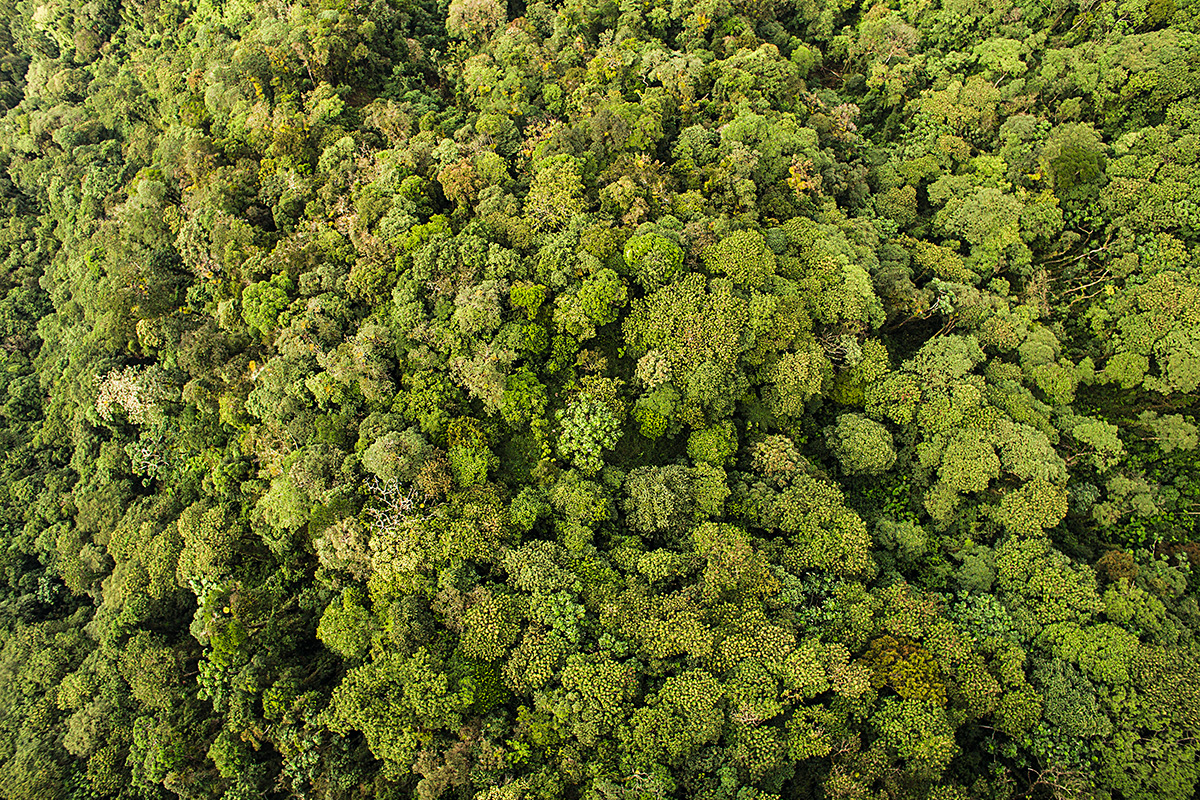
When biologists first started talking about diversity, they simply meant the number of species in a community, the so-called «species richness». At first glance this kind of diversity seems to be conceptually simple to interpret, and it undoubtedly captures an important quality of an ecosystem. In practice, however, it is almost impossible to accurately count the number of species in rich communities, where most of the species are typically rare. For example, Phil DeVries, Tom Walla, and Harold Greeney collected butterflies at a single site in the Amazon rainforest for ten years (DeVries & Walla, 2001). Even at the end of those ten years of intense collecting, they were still adding species they had never before collected, and this is typical of tropical ecosystems. In such places, the species count depends strongly on the sampling effort and also on the distribution of abundance across species. Using statistical tools based on Alan Turing’s WWII codebreaking efforts for the British, Anne Chao developed an estimator for a lower bound on the total number of species in a community (Chao, 1984), but the actual total number of species cannot be estimated without bias.
In spite of the difficulty of its estimation, species richness is still an important biological community parameter for many theoretical and practical purposes. For example, it is very useful when prioritizing areas for conservation. However, there are many applications in which a simple species count is not sufficient. An oak forest with a few pine trees is very different from a pine forest with a few oak trees. A ten-species butterfly community with one abundant species and nine vanishingly rare ones is, in many ecological aspects, more similar to a butterfly community with only one species than to a butterfly community with ten equally common species. It matters how the individuals are distributed among the species. A simple presence-or-absence species count does not capture this difference. Biologists needed to expand their diversity concept to account for abundances when needed. For a given number of species, the maximum possible diversity should occur when all species are equally common, and the minimum possible diversity should occur when all but one of the species were vanishingly rare. Then diversity would drop continuously as species headed towards extinction.
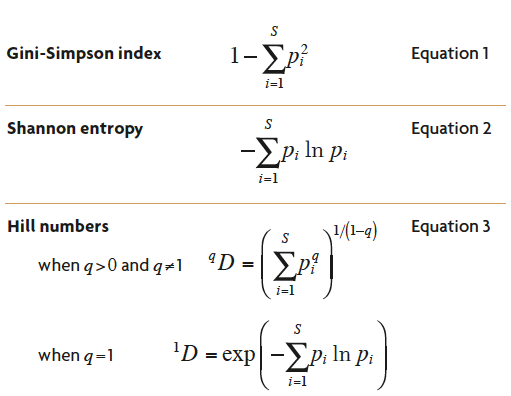
Table 1. The most important mathematical expressions used for the calculation of ecological diversity. S = number of species; pi = the relative abundance of i-th species, the number of individuals of species i in the community divided by the total number of individuals of all S species; q is a free parameter that determines the measure’s sensitivity to species relative abundances.
Measures which behave like this are important in many disciplines that deal with complex systems. They are especially prominent in economics, where they (or their inverses or complements) are used to measure such things as the concentration of wealth among individuals or the concentration of industrial capacity among corporations. Economists had long ago formalized the conditions under which concentration should decrease (and its inverse, diversity, should increase). The main condition is called the «Pigou-Dalton principle of transfers» (Jost, 2010). Expressed in biological terms, for a fixed number of species and fixed number of individuals, diversity should increase when abundance is transferred from one species to another strictly rarer species. Diversity should also increase when a new vanishingly-rare species is added.
Many biologically significant ecosystem properties obey the principle of transfers. For example, imagine an ecosystem with a given number of species, in which each individual wanders around at random and occasionally encounters another individual. When two individuals encounter each other, the probability that the two individuals belong to different species can be calculated. This is sometimes called the Gini-Simpson index (Table 1, Equation 1), and it was often equated with diversity in the past. The probability that an encounter will be interspecific is a minimum when all but one species are vanishingly rare. As abundance is transferred from the commoner species to the rarer ones, this probability increases until it reaches a maximum when all species are equally common. Thus the «probability of an interspecific encounter» obeys the principle of transfers and can serve as a measure of the compositional complexity of an ecosystem. Another property of an ecosystem which behaves this way is the uncertainty in the species identity of an individual randomly drawn from the community. This uncertainty can be calculated from the relative abundances of each species by using information theory (Shannon, 1948), and is just the Shannon entropy (Table 1, Equation 2). Biologists often called it the Shannon-Weiner index or the Shannon-Weaver index. For a given number of species, it is minimized when all but one species are vanishingly rare, and it is maximized when all species are equally common. This measure of compositional complexity was also often equated with diversity in the past.
Interpreting diversity measures
The three measures I have mentioned so far – species richness, Shannon entropy, and the Gini-Simpson index – have all been used to quantify diversity, often in the same article. Yet each of these measures has different units and different mathematical behaviors. Species richness was a discrete measure with integer values, and with units of «species», while Shannon entropy was a continuous function with no upper limit, in units of «bits», and the Gini-Simpson index was a probability, which could never exceed unity. While these measures were all certainly related to the diversity concept of biology, they each had such different mathematical properties that their values could not be directly compared, and forms of reasoning that worked with one of them would generally be invalid when applied to the other two. This chaos seemed to argue against the existence of a reasonably precise but general, useful diversity concept.
«Species richness is still an important biological community parameter for many theoretical and practical purposes»
Yet biologists continued to apply similar forms of reasoning to all three of these measures, as if they had a single diversity concept in their heads. For example, it was common to look at the percent change in each of these measures due to some human or natural impact. This was problematic because biologists were applying ratio or percent comparisons to measures that were highly nonlinear (Moreno, Barragán, Pineda, & Pavón, 2011). This method of judging the magnitude of an impact could give misleading results when applied to Shannon entropy, which is a logarithmic measure. It was even more misleading when applied to the Gini-Simpson index. Since that index cannot exceed unity, all high-diversity communities had very similar index values close to unity. A biologically huge change in a community (say, the extinction of 90 % of the species) might result in a change of less than 1 % in the value of this index.
This problem became more obvious when biologists began to use diversity measures to assess the compositional similarity between communities. Biologists sensed that there was a deep connection between compositional similarity and diversity. In two communities with the same species at the same relative abundances, if they were pooled in equal proportions, the diversity of the pooled communities would be the same as the diversity of the original communities. On the other hand, if the two original communities were very different from each other in composition, then the diversity of the pooled communities would be much higher than the mean of the diversities of the individual communities. By comparing the mean within-community diversity to the diversity of the pooled communities, the relative degree of compositional similarity between the communities could be quantified. The comparison was usually done by dividing the two diversities (Lande, 1996). This worked well when species richness was the diversity measure, but for Shannon entropy and the Gini-Simpson index it ran into the same problems as those mentioned in the preceding paragraph; those measures are strongly non-linear, so ratio comparisons are misleading. For example, the Gini-Simpson index cannot exceed 1.00, so when the Gini-Simpson indices of the individual communities were near unity, pooling them could not make the Gini-Simpson index rise much, even if the communities were completely different (no species in common). Dividing these two diversities necessarily gives a number close to unity, supposedly indicating a high degree of compositional similarity, no matter whether the communities are nearly identical or completely different (Jost, 2006, 2007; Jost et al., 2010).
The difficulty of interpreting these and other results from the Gini-Simpson index and Shannon entropy led some biologists to doubt the utility of these measures in biology. The problem, however, was not with the measures but with biologists’ insistence on applying the same rules of inference to all these measures, as if they all had the same mathematical properties as species richness.

Figure 1. Diversity profiles of two communities with the same number of species (s = 100) and individuals (n = 1,000), but different evenness. In profile A, there are a few very dominant species, while the rest are less abundant. In profile B, all species have a similar number of individuals, i.e., there is more evenness. The Hill numbers (the effective number of species) are used as a master formula to compare the effective number of species in a simple way with parameter q, which determines the sensibility of the measure to relative abundance. This allows us to compare – graphically as well – different diversity profiles like A and B. Both have the same number of species and, therefore, the same order q = 0 diversity, but the distribution of individuals in each species is different. A greater imbalance (less evenness) involves less order 1 and order 2 diversity for community A.
Toward a master formula
A key step forward was the discovery, made independently in the late 1900s by scientists in fields as different as ecology, economics, information theory, and physics, that all three of these seemingly unrelated «diversity» measures (or simple transformations of them) could in fact be generated by a single general master formula. Several master formulas were discovered, different in each discipline, but they were simple monotonic transformations of each other, so they were essentially all the same. They were mostly interpreted as generalizations of Shannon entropy. One of the best-known of these master formulas generated the family of Rényi entropies (Rényi, 1961), and another popular one generated the Tsallis (or HCDT) entropies (e.g., Tsallis, 1988). These master formulas could generate each of the three «diversity» measures, or simple transformations of them, by varying a parameter q, which controlled the measure’s sensitivity to the relative abundances of the species. When q = 0, each of these master formulas gave species richness, or a simple transformation of it; when q = 1 the master formulas were undefined but yielded Shannon entropy, or a simple transformation of it, in the limit as q approached 1; and when q = 2 the master formulas gave the Gini-Simpson index, or a simple transformation of it. This was a very interesting and important unification of what had once seemed like a smorgasboard of unrelated measures. It was the first sign that there might be a rich and deep «mathematics of diversity» that could bring order to the field.
These master formulas were not limited to the values 0, 1, or 2 for the parameter q. Any value of q ≥ 0 could be used, and by graphing the master formula versus q, one could create a smooth curve called a «(Rényi or Tsallis) entropy spectrum» of the community. These curves provide an alternate way of expressing the information contained in a community’s species relative abundance distribution. A community is unambiguously more diverse than another community if its profile lies above the other community’s profile. If the profiles cross, the diversity ordering is ambiguous, depending on how the species relative abundances are weighted.
The next big step forward was the realization, by ecologist Mark Hill and economists Hannah and Kay, that the master formulas could be transformed so that they generated a family of measures (Table 1, Equation 3) with the same easy-to-use metric as species richness, instead of generating nonlinear entropies (Hannah & Kay, 1977; Hill, 1973). The measures generated by the new master formula obey a principle that had already become a keystone of modern economics, and which was implicit in many of the ways that biologists reasoned about diversity. In economics the principle was called the «replication principle»: if we pool N equally diverse, equally large communities with no shared species, the diversity of the pooled communities should be N times the diversity of a single community. Measures that obey this principle are linear with respect to pooling. Here was the solution to the bad behaviors of ratio comparisons involving Shannon entropy or the Gini-Simpson index! Those two measures, and their relatives for other values of the parameter q, could now be transformed into measures that gave the right results in ratio and percentage comparisons. Finally, we had measures of diversity that supported the rules of inference which biologists had been using previously on inappropriate nonlinear measures.
«An oak forest with a few pine trees is very different from a pine forest with a few oak trees. It matters how the individuals are distributed among the species»
These new diversity measures are in units of «effective number of species», which are best explained by means of an example. Suppose a community’s species abundance distribution has a Shannon entropy of 2.77 (using logarithms to the base e). We could judge the magnitude of that number, 2.77, by building a reference community with the same entropy but consisting entirely of X equally common species. It is a matter of algebra to find out what X has to be, and in this case it turns out that X = 16 equally common species; a community with 16 equally common species has the same entropy as the real community, 2.77. Thus the «effective number of species» for a Shannon entropy of 2.77 corresponds to 16. If we use variables instead of particular numbers in this example, we would derive the general formula to convert Shannon entropy to effective number of species; the conversion formula turns out to be simply exp(H) where H is Shannon entropy using natural logarithms.
We could repeat the process with a second community whose entropy was 3.46. At first glance this might not seem so different from the entropy of the first community, 2.77. However, it turns out that it takes 32 equally-common species to have an entropy of 3.46. As far as Shannon entropy is concerned, the difference between the first and second community is the same as the difference in entropy between a community of 16 equally-common species and a community of 32 equally-common species. This shows how misleading the raw values of Shannon entropy can be when judging ecosystem changes. When the entropies are converted to effective number of species in this way, a better sense of their meaning can be obtained. Also, the «effective number of species» is independent of the base used in taking the logarithm in the entropy.
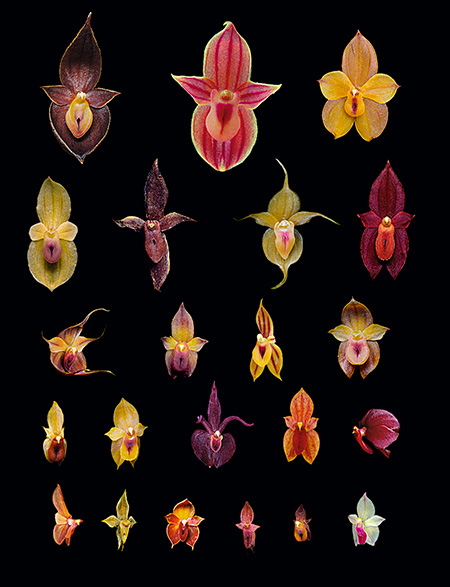
Local evolutionary radiation of new species of orchids in the genus Teagueia recently discovered in eastern Ecuador. This is an example of high species diversity but low phylogenetic diversity. / © Lou Jost/EcoMinga
The same approach can be used to find the effective number of species for the Gini-Simpson index or any of the other generalized entropies generated by the master formulas discussed earlier. They all lead to a single master formula for the effective number of species as a function of the same parameter q that gave us the entropy profile of a community; the parameter q determines the sensitivity of the measure to species relative abundances (Table 1). The graph of effective number of species versus q (for q ranging from zero to infinity) is the «diversity profile» of the community. Conversion of all of the different traditional complexity measures to the same simple metric, effective number of species, allows us to compare them directly to learn something about a community’s structure (Figure 1). No longer are we comparing number of species, number of bits, and probabilities, which was like comparing apples and oranges. Best of all, when the traditional abundance-sensitive complexity measures are converted to effective number of species, they obey the replication principle described above, just like species richness. This gives them some (though not all) of the nice intuitive properties of species richness. For example, effective number of species permit measurement of community similarity by looking at the ratio of mean within-group diversity to total pooled diversity, the same technique that biologists mistakenly tried to use with traditional measures. The well-developed mathematics underlying effective number of species also reveals how to partition diversity into independent within- and between-group components, and shows how those components are related to commonly-used measures of similarity between ecosystems. The effective number of species, then, best quantifies the diversity concept actually used by most biologists.
The diversity concept was developed to accurately describe fundamental aspects of ecosystems. However, in order to move the field forward, the descriptive language should also connect to predictive theory. The concept of diversity in terms of effective number of species turns out to have deep connections to the most important ecosystem and population models used by ecologists, such as the neutral model by Hubbell (2001). The expected values of the generalized entropies and the effective number of species for q = 0, 1, and 2 are simple analytical functions of the fundamental parameters of Hubbell’s model (Chao et al., 2015). This means biologists can predict diversity, and the compositional similarity between ecosystems, from fundamental parameters like population size and speciation rate, in the case of idealized simple models. Biologists are still a long way from being able to predict these things for messy real-world ecosystems, but this is the important first step.
«Biologists can predict diversity, and the compositional similarity between ecosystems in the case of idealized simple models»
Expanding the concept of diversity
Is this diversity concept perfect? Certainly not. One of its underlying abstractions is that all species are equally different from each other. A set of five rat species has the same diversity as a set consisting of one rat, one armadillo, one manatee, one pangolin, and one monkey, if the set of relative abundances are the same for both. The standard diversity measures depend only on the relative abundances of each species, not on their degree of differentiation. Yet there is far more evolutionary history embodied in the second set, and therefore far more conservation value. With the rise of gene sequencing techniques, we can now objectively measure the divergence times between species, so the simple traditional concept of diversity has recently been expanded to incorporate the amount of unique evolutionary history contained in each community. This was initially done by generalizing the traditional species richness, Shannon entropy, and especially the Gini-Simpson index to incorporate divergence times, but the generalizations of the latter two measures inherited the same interpretational problems as their parent measures. More recently the whole framework of diversity as effective number of species, with all its partitioning and similarity measures, has been generalized to include divergence times, so that there is now a mathematically rigorous approach ready to tackle novel ecological questions that we could hardly imagine a few decades ago (Chao, Chiu, & Jost, 2010). There is also ongoing work on including functional differences between species (e.g., Chao, Chiu, & Jost, 2014), though these differences are much harder to quantify objectively than evolutionary divergence times.
In spite of these advances in the mathematics of diversity, it is essential to be aware that diversity is just one parameter, and a full picture requires additional descriptive parameters. For example, most of the developments to date have focused on measures of diversity which depend on relative abundances. These measures work well for ecosystems that have fixed densities of individuals, such as a typical forest tree ecosystem, where species composition may change between sites or years but density is more or less stable. However, in some ecosystems there can be rapid fluctuations in total density, as in some terrestrial insect communities that are briefly augmented by the mass emergence of flying adults of aquatic insects that grew up in distant lakes. When a new superabundant species is introduced to an ecosystem, abundance-sensitive diversity measures fall dramatically, because such measures are influenced by the evenness of the relative abundance distribution. This fall in diversity (for q > 0) is an accurate description of the sudden drop in complexity; it is now very likely that any given interaction between two individuals will be between conspecifics (namely, the superabundant species) rather than between different species. However, this is not the kind of drop in diversity that should worry conservationists. To decide whether or not we should be worried when diversity drops, we need additional information about absolute abundances. In the case of an explosive insect invasion, a species accumulation curve as a function of sampling effort would tell us whether or not there was something to worry about. Diversity is a powerful concept, but it is not the only thing we need to know about an ecosystem!
1. Havrda-Charvat-Daroczy-Tsallis. (Go back)
Chao, A. (1984). Nonparametric estimation of the number of classes in a population. Scandinavian Journal of Statistics, 11(4), 265–270.
Chao, A., Chiu, C. H., & Jost, L. (2010). Phylogenetic diversity measures based on Hill numbers. Philosophical Transactions of the Royal Society B Biological Sciences, 365(1558), 3599–3609. doi: 10.1098/rstb.2010.0272
Chao, A., Chiu, C. H., & Jost, L. (2014). Unifying species diversity, phylogenetic diversity, functional diversity, and related similarity and differentiation measures through Hill numbers. Annual Review of Ecology, Evolution, and Systematics, 45(1), 297–324. doi: 10.1146/annurev-ecolsys-120213-091540
Chao, A., Jost, L., Hsieh, T. C., Ma, K. H., Sherwin, W., & Rollins, L. A. (2015). Expected Shannon entropy and Shannon differentiation between subpopulations for neutral genes under the finite island model. PLOS ONE, 10(6), e0125471. doi: 10.1371/journal.pone.0125471
DeVries, P. J., & Walla, T. R. (2001). Species diversity and community structure in neotropical fruit-feeding butterflies. Biological Journal of the Linnean Society, 74(1), 1–15. doi: 10.1006/bijl.2001.0571
Hannah, L., & Kay, J. A. (1977). Concentration in modern industry. Theory, measurement and the UK experience. Londres: Macmillan.
Hill, M. (1973). Diversity and evenness: A unifying notation and its consequences. Ecology, 54, 427–432. doi: 10.2307/1934352
Hubbell, S. P. (2001). A unified theory of biodiversity and biogeography. Princeton, NJ: Princeton University Press.
Jost, L. (2006). Entropy and diversity. Oikos, 113(2), 363–375. doi: 10.1111/j.2006.0030-1299.14714.x
Jost, L. (2007). Partitioning diversity into independent alpha and beta components. Ecology, 88(10), 2427–2439. doi: 10.1890/06-1736.1
Jost, L. (2010). The relation between evenness and diversity. Diversity, 2(2), 207–232. doi: 10.3390/d2020207
Jost, L., DeVries, P. J., Walla, T., Greeney, H., Chao, A., & Ricotta, C. (2010). Partitioning diversity for conservation analyses. Diversity and Distributions, 16(1), 65–76. doi: 10.1111/j.1472-4642.2009.00626.x
Lande, R. (1996). Statistics and partitioning of species diversity and similarity among multiple communities. Oikos, 76(1), 5–13. doi: 10.2307/3545743
Moreno, C. E., Barragán, F., Pineda, E., & Pavón, N. P. (2011). Reanálisis de la diversidad alfa: Alternativas para interpretar y comparar información sobre comunidades ecológicas. Revista Mexicana de Biodiversidad, 82(4), 1249–1261. doi: 10.22201/ib.20078706e.2011.4.745
Rényi, A. (1961). On measures of information and entropy. En J. Neyman (Ed.), Proceedings of the fourth Berkeley Symposium on Mathematics, Statistics and Probability 1960 (pp. 547–561). Berkeley, CA: University of California Press.
Shannon, C. (1948). A mathematical theory of communication. Bell System Technical Journal, 27(3), 379–423. doi: 10.1002/j.1538-7305.1948.tb01338.x
Tsallis, C. (1988). Possible generalization of Boltzmann-Gibbs statistics. Journal of Statistical Physics, 52, 479–487.